
Please vote in our Instant Polls about the ACCA P5 September 2017 Exam
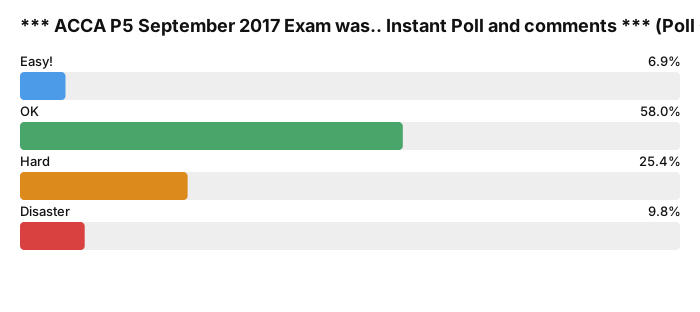
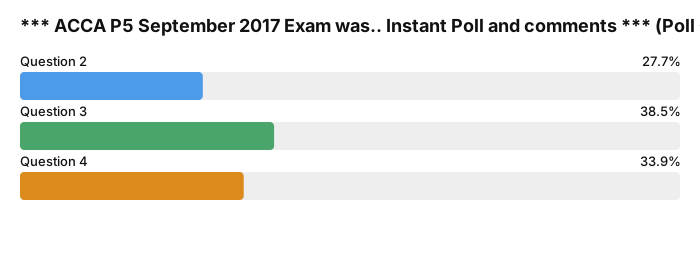 Post your comments about the ACCA P5 exam below
(comments will open after 5pm UK)
 Post your comments about the ACCA P5 exam below
(comments will open after 5pm UK)
@vaskont7 said: Well we havee some reconciling items...hehe. :p :p. just kidding... more or less is the same .. we are the same at 4 from your points (i didnt write down the 1st one..but i saw that most of you did...so itt was a kind of clisee, but my practise at exam kit book wwas poor)... i also mentioned that it was not a good choise to benchmark against a company that its on a different b phase... (the had already moved into electr cars 2 years ago) cause is a kind of "manipulating" benchmarking exercise...it would be better to benchmark against a company that is exactly on the same phase....however i dont know whether that was a good one. it may be stupid...anyways..just wrote it down to have 5 points ( it was a 7 points question, isnt it?)@vaskont7 It was 9 marks question and I wrote about 7 points in it. What did you write in dashboard question? These are my points from dashboard question: -Benefits of EVA being a very good measure in dashboard(3 Sub points) -closer to cash -shareholders long term value -supports non financial behaviors like r&d and discourages dysfunctional behavior -TSR: - considers shareholder return and dividends which will be vital -in particular thyme recently lost cash and TSR will show it's share performance and incentives it's taking Operating Margin: Basic measure will show profits from the operations, so good to evaluate profitability Design: Very key part in manufacturing sector, leads to competitive advantage and critical factor to customer satisfaction, But there was no measure regarding design quality/safety as thyme's engine recently failed Delivery: Sells internationally so delivery is obviously very vital, also it leads to customer satisfaction as they will be depending upon us and is a good measure of level of customer service we provide (also one of thyne's main objective) But I did find out one flaw with it that there was no measure for the customer service such as TECHNICAL QUERRIES RESOLVED, now if we are producing engine and our customer is producing planes, their staff and management may have technical querries, We may need to respond to those immediately to help our customers. -# of products set right at first, Also supports TQM approach of the, very good measure to evaluate how good our quality standards are and how well do we produce the things without defects that lead to lower wastages as well and efficient business cycle. -Revenue Growth: Shows the growth in revenue and if we are to aim to be world class, we need to broaden ourselves up, so need to ensure a good revenue rise so worthwhile to have that in benchmark. -Market Share: We need to know where to we stand right now and this is what market share in the dashboard tells us, if we are aiming to be higher and better we need to know where we are currently. Also takes account of competition as how good we are against them -Dashboard was well presented and was not overloaded which will lead to board having ease to use these figures -Management commentary also provided ease to know what the figures represent and making use of dashboard areas -It showed a good trend from past two years which definitely shows how we are SHAPING UP to the future, including policies like TQM -However they may have produced some external information rather than budgets to make it more useful (this could be due to govt being obsessed with budgets) and also some graphical representation of KPI would've been better -All in all it was a well designed dashboard which covered good areas. And was rewarded due to it's positives with respect to dimensions of performance being covered
@sa1pw said: @vaskont7 It was 9 marks question and I wrote about 7 points in it. What did you write in dashboard question? These are my points from dashboard question: -Benefits of EVA being a very good measure in dashboard(3 Sub points) -closer to cash -shareholders long term value -supports non financial behaviors like r&d and discourages dysfunctional behavior -TSR: - considers shareholder return and dividends which will be vital -in particular thyme recently lost cash and TSR will show it's share performance and incentives it's taking Operating Margin: Basic measure will show profits from the operations, so good to evaluate profitability Design: Very key part in manufacturing sector, leads to competitive advantage and critical factor to customer satisfaction, But there was no measure regarding design quality/safety as thyme's engine recently failed Delivery: Sells internationally so delivery is obviously very vital, also it leads to customer satisfaction as they will be depending upon us and is a good measure of level of customer service we provide (also one of thyne's main objective) But I did find out one flaw with it that there was no measure for the customer service such as TECHNICAL QUERRIES RESOLVED, now if we are producing engine and our customer is producing planes, their staff and management may have technical querries, We may need to respond to those immediately to help our customers. -# of products set right at first, Also supports TQM approach of the, very good measure to evaluate how good our quality standards are and how well do we produce the things without defects that lead to lower wastages as well and efficient business cycle. -Revenue Growth: Shows the growth in revenue and if we are to aim to be world class, we need to broaden ourselves up, so need to ensure a good revenue rise so worthwhile to have that in benchmark. -Market Share: We need to know where to we stand right now and this is what market share in the dashboard tells us, if we are aiming to be higher and better we need to know where we are currently. Also takes account of competition as how good we are against them -Dashboard was well presented and was not overloaded which will lead to board having ease to use these figures -Management commentary also provided ease to know what the figures represent and making use of dashboard areas -It showed a good trend from past two years which definitely shows how we are SHAPING UP to the future, including policies like TQM -However they may have produced some external information rather than budgets to make it more useful (this could be due to govt being obsessed with budgets) and also some graphical representation of KPI would've been better -All in all it was a well designed dashboard which covered good areas. And was rewarded due to it's positives with respect to dimensions of performance being coveredThis seems to cover most of the points on the dashboard. I used a balanced scorecard approach as the dashboard covers financial perspective, customer perspective, innovation, and internal perspectives. I then drilled down on each of the indicators under each perspective. Overall the dashboard is strategic, simple, and shows clarity in terms of PAIL, purpose, intended audience, information provided, and length.
@tobi6 said: This seems to cover most of the points on the dashboard. I used a balanced scorecard approach as the dashboard covers financial perspective, customer perspective, innovation, and internal perspectives. I then drilled down on each of the indicators under each perspective. Overall the dashboard is strategic, simple, and shows clarity in terms of PAIL, purpose, intended audience, information provided, and length.Balanced Scorecard could've been used but I refrained and went for an overall comment because it wanted to know why the dashboard got the award in which you had to mention good points of the dashboard as well as it's indicators although I mentioned some drawbacks as well but overall it was good because it's positives we're alot more than negatives.
 Former user9y ago#64
@tobi6 said: This seems to cover most of the points on the dashboard. I used a balanced scorecard approach as the dashboard covers financial perspective, customer perspective, innovation, and internal perspectives. I then drilled down on each of the indicators under each perspective. Overall the dashboard is strategic, simple, and shows clarity in terms of PAIL, purpose, intended audience, information provided, and length.my oh my....this is spot on, with analysis using these, I doubt if I will pass this paper. didn't even occur to me to use these. wowww, weldone, nice one
@fumsky002 said:
@tobi6 said: This seems to cover most of the points on the dashboard. I used a balanced scorecard approach as the dashboard covers financial perspective, customer perspective, innovation, and internal perspectives. I then drilled down on each of the indicators under each perspective. Overall the dashboard is strategic, simple, and shows clarity in terms of PAIL, purpose, intended audience, information provided, and length.my oh my....this is spot on, with analysis using these, I doubt if I will pass this paper. didn't even occur to me to use these. wowww, weldone, nice one