
Internal analysis


1 Porter’s value chain
Porter’s value chain is used to examine how a business makes profits or margin.
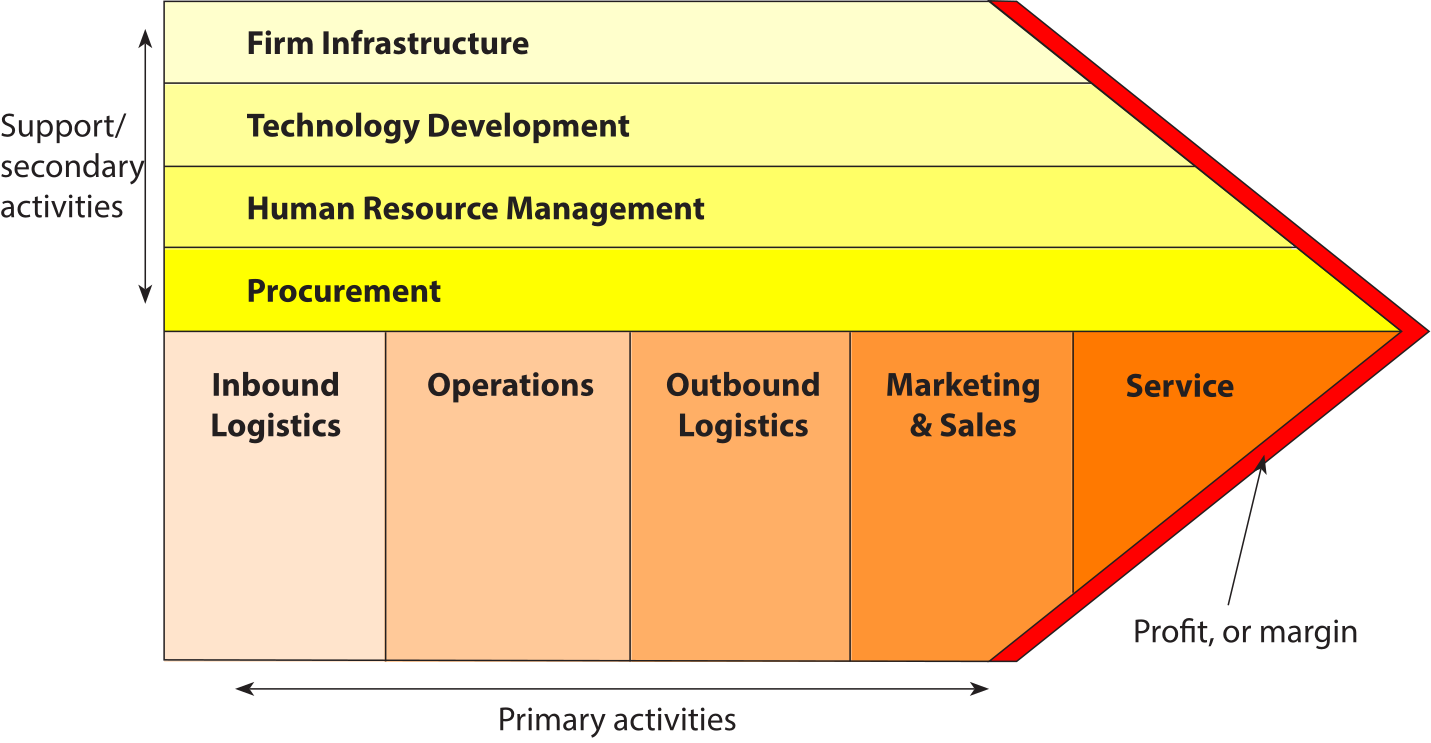
The primary activities are set out across the bottom of the diagram: inbound logistics, operations, outbound logistics, marketing and sales, and service. More or less these activities will equate to direct costs.
The support or secondary activities are set out across the top of the diagram: firm infrastructure, technology development, human resource management, and procurement. By and large they equate to indirect costs.
It has to be stressed that activities are shown in the diagram. However, every activity has an associated cost, and if all activities are represented there, so should all costs, and these could be allocated and apportioned, and so mapped to somewhere on to this diagram. Rent, for example could be apportioned over the operations that is the factory, the warehouse, head office, and the marketing and sales department. Similarly with depreciation, heating costs, wages and salaries.
So, all the organisation’s costs can appear on this diagram. Let’s say these amounted to $10 million. The goods and services produced by the organisation will be sold, let’s say for $15 million. How come therefore buyers are willing to spend $15 million on what cost the organisation only $10 million? For what possible reason are customers willing to spend an extra $5 million over and above what the goods or services cost to produce?
The extra $5 million has to be explained somehow. It is known as ‘value-added’, and it is explained by arguing that the organisation accomplishes more for its customers than simply carrying out the activities and incurring the costs that can be spread over the sections of the value chain. The organisation must be doing something else. For example, it could be bringing skills and know-how to the process. Effectively it is bringing competences to the process. It could bring convenience to the buyer, allowing the buyer to keep everything bought from the organisation as a variable cost rather than taking on board many of the fixed costs. It may bring economies of scale and the buyer is willing to pay for this because it will be impossible for the buyer to replicate these on a smaller scale.
The organisation must understand what it is that adds value, as this is the reason it can make profits. Furthermore, the organisation must understand how the different sections of the value chain are linked. It could be, for example, that if more were spent on human resource management perhaps less would need to be spent on operations because employees are better trained. If more were spent on technology development perhaps less could be spend on after sales service because the quality of the finish goods was higher.
Understanding the value chain is essential for organisations so that they know how their profit is generated. It has to be said, however, that sometimes organisations make mistakes identifying what it is about their activities that adds, value for the customer and they make changes which reduce their ability to make profits.
Although originally formulated for manufacturing industries, value chains can also be applied to service industries. Although the importance of some elements, such as inbound logistics, will reduce, the importance of other elements, such as human resources, can increase because employees in service industries are usually more customer facing and can have a great effect on the service being sold.
2 Value networks
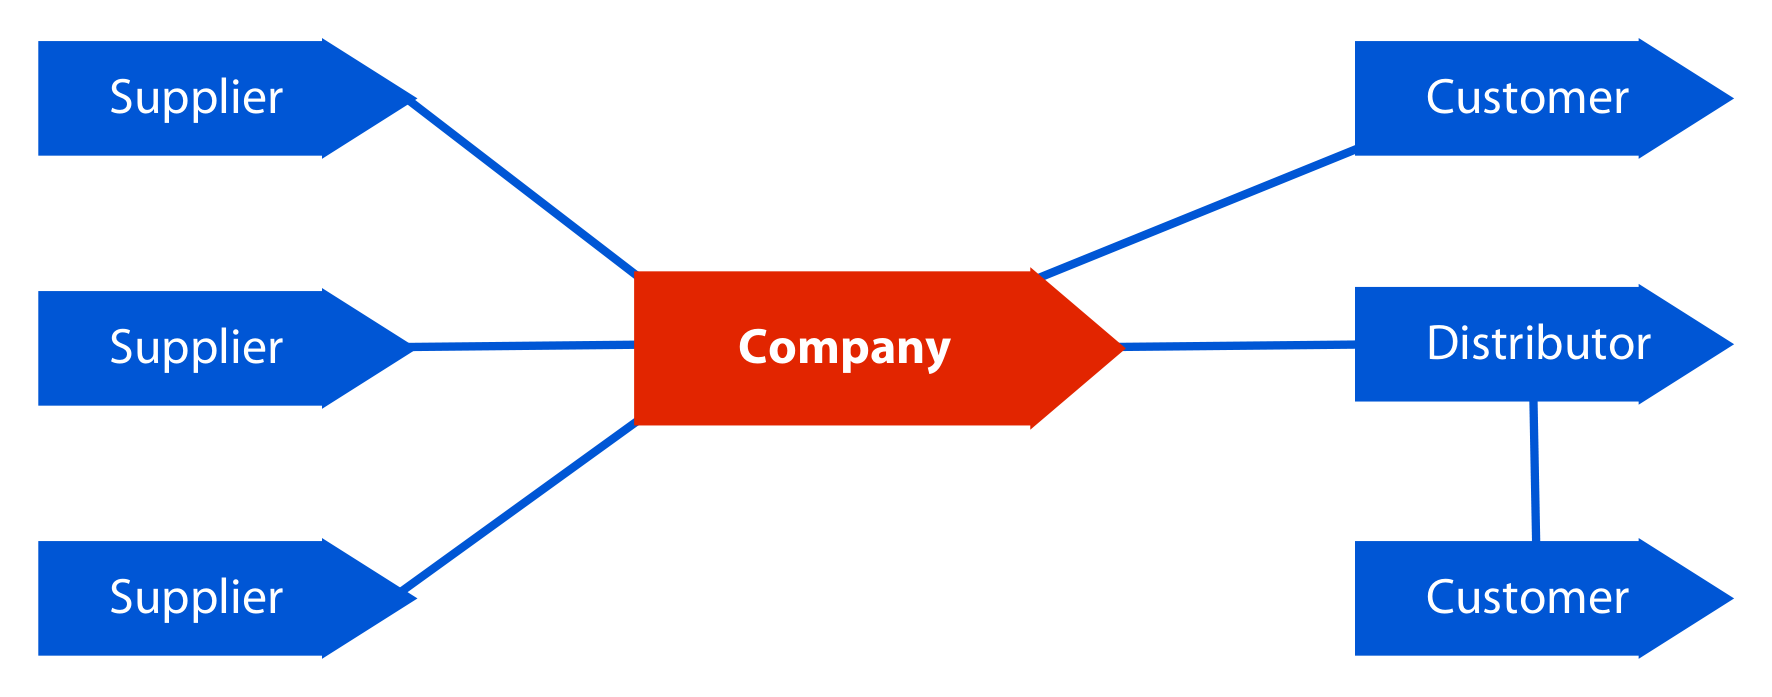
Value networks recognise that few companies stand alone and that what is ultimately supplied to and paid for by customers depends on activities carried on by many suppliers, distributors and, indeed, logistics companies.
Ultimately, customer satisfaction and value added depend on all parties working well together.
A value network joins an organisation’s value chain to those of its suppliers and customers. It recognises that a company is dependent on its suppliers and its distributors to ensure that products are made and are bought by the final consumers. What is ultimately offered to consumers is the end result of all parts of the value network and if value is to be added successfully, all parts of the network should contribute.
For example, Volkswagen does not make all components itself (many are bought from supplier like Robert Bosch) and value added by suppliers, logistics companies and retailers are all relevant to what the consumer will be prepared to pay.
3 Boston Consulting Group Matrix (BCG)
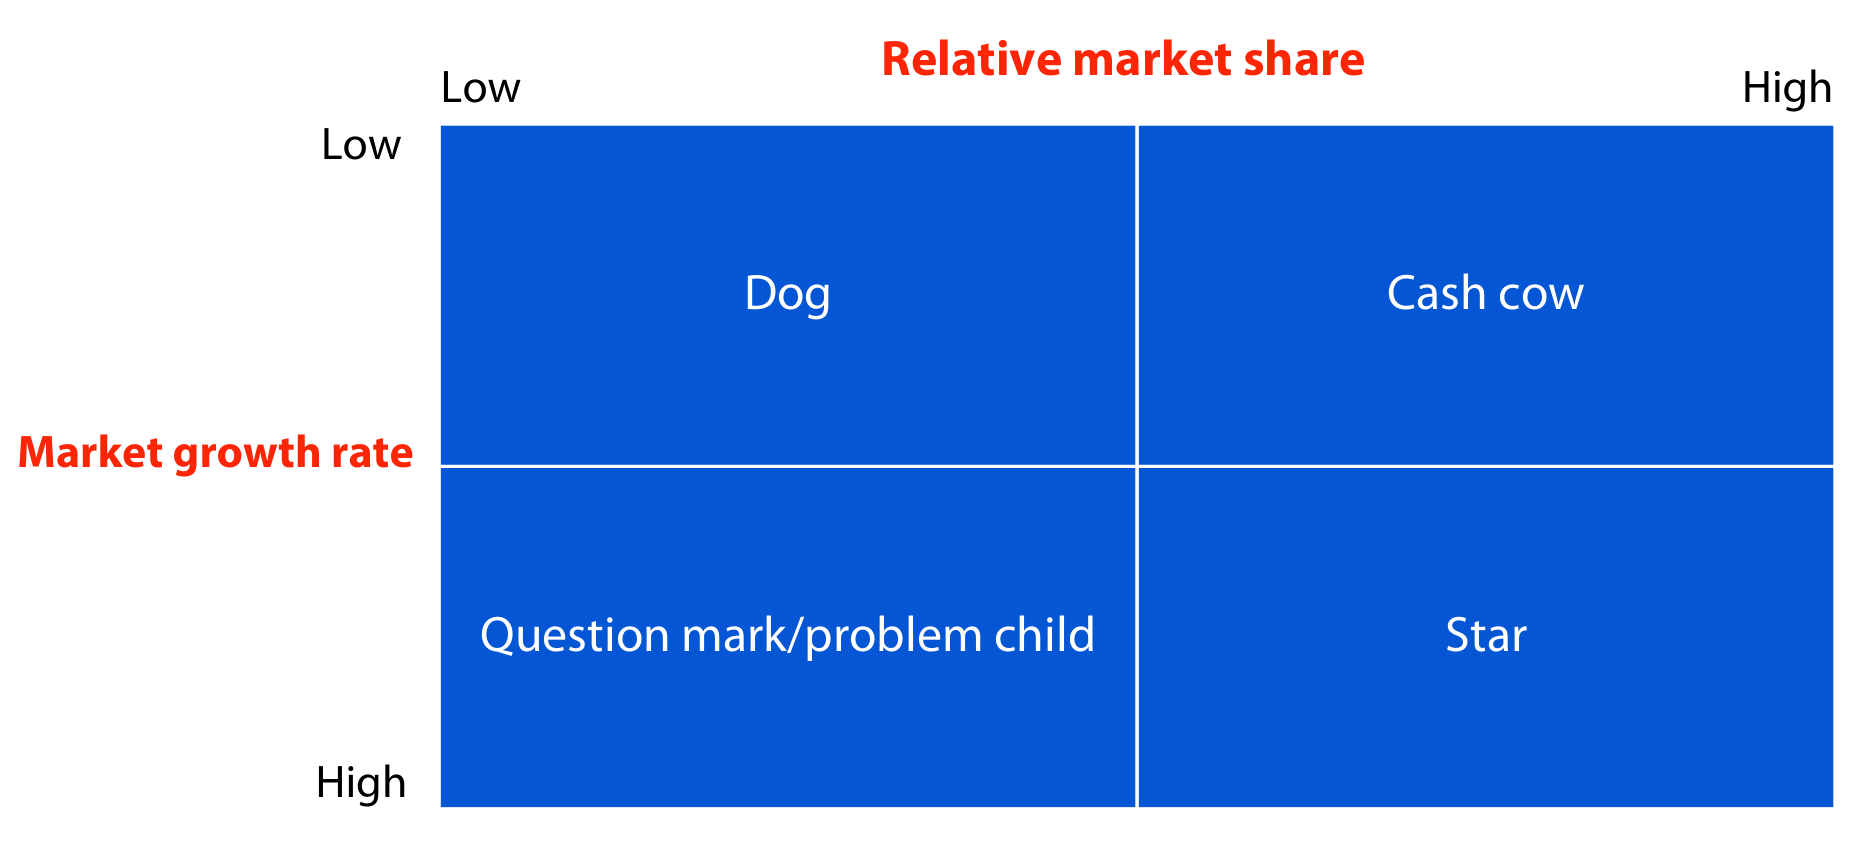
The Boston Consulting Group Matrix is another very well-known analysis tool. Note that it is sometimes known as a portfolio analysis and it really makes sense to use the BCG Matrix if there is more than one product (or product line) in a company’s portfolio. The axes of the matrix are relative market share and the market or industry growth rate.
Relative market share = The company’s market share/Largest market share
Note the word relative in that formula: the comparison is with the largest competitor, not with the market as a whole. A business holding 35% of its market is on the low side of this axis if a rival holds 50%, so it is not a cash cow. Two further traps follow from the chapter’s own caution about interpretation. There is no rule that a portfolio contains one product per quadrant, so do not force a product into an empty box; and a classification on its own earns little — a question that asks for strategies to manage the portfolio wants the strategy for each product explained and justified, not the word hold or harvest on its own.
We’ll go through each quadrant in turn.
Question mark/problem child. This product has a high growth rate but a low market share. Why is it known as a question mark or problem child? Well, the BCG analysis suggests that there is no long-term future for this product if it has only a small market share. Suppliers who have large market shares have much greater economies of scale and could easily dominate the small supplier. The question therefore is: should we get out of this product or should we try and grab a large market share? If we go for the large market share, this will require investment. It will be a heavily negative cash flow because money has to be spent on promotion, research and development or investing the margin (that is reducing the selling price to win a higher market share).
Star products. If the quest by the problem child for high market share is successful, the product will become a star. This isn’t as good as it sounds. Although we now have a high market share (and therefore would enjoy economies of scale and are well down the experience curve), because we have one of the highest market shares, and highest profiles, competitors will be trying to steal market share from us. We will be the target for competitors also wanting to gain a high market share. Remember, if the market has a high growth rate this product is perceived as a product with a future and many companies will be anxious to get a large share of the action. Therefore, cash flow with the star product is usually soon to be roughly zero.
Cash cows. The initially high growth rate of products will always slow down, perhaps to zero or even becoming negative (a declining market). The product then becomes a cash cow. It’s a cash cow because we still have a high market share but nearly all the initial expenses will have been written off. Also, because this is now perceived as an old product, competitors will not be keen in stealing market share from us. Essentially, they leave us alone. We therefore enjoy high cash inflows without having to spend a lot on promotion, or research and development, or defending our market share.
The dog sector is on its own. Cash cow products do not turn into dogs! This is a product which has a low growth rate and we don’t have much of a market share. Therefore, get out of it: divest. There’s no point spending time effort and money achieving a high market share in an old product. So, close down the production facilities or try to sell them to another company.
There are considerable flaws in the BCG analysis. For example:
It puts a lot of emphasis on the importance of a high market share, but there are many companies with only small market shares which are successful in the long-term. For example, the Porsche car company has a small market share when compared to Ford, General Motors and Toyota. Yet, it is one of the most profitable car companies per car sold in the world. Really, you have to define very carefully what your market is. That can be room for relatively small specialist suppliers who can continue to make good profits year in, year out.
The second problem is to do with how the BCG is interpreted. If a product went from just being a star product to just being a cash cow product because of a slight change in market growth rate, to suddenly cutback massively on promotion, research and development, and defending the product. The interpretation must not be too black and white. If market growth rate goes from 10.1 to 9.9, with 10 being the division between star and cash cow, in reality not a lot has changed and the change in treatment of the produce should not be abrupt.
Third, relative market share and market growth rate are probably inadequate measures. By relative market share we really mean competitive strength, but there’s much more to competitive strength than just our market share. For example, our brand name, or the location of our production facilities are located can give us very high competitive strength. Similarly, instead of just having a market growth rate what we really mean is market attractiveness. Attractiveness depends on factors such as risk and the amount of competition present in that market. We might prefer to go for a product which has a relatively low growth rate, but which is relatively low risk.
These criticisms do not mean that BCG is useless but, like any model, care needs to be exercised in interpreting the results. No model guarantees the truth.
Finally let’s return to the name portfolio analysis. If we have lots and lots of problem children they will all require financing and where is that money going to come from? If we have almost exclusively cash cows we have a very positive cash flow now, but a few years down the line the market for those cash cows could have declined rapidly and what are we going to replace those cash flows with?
A well-balanced portfolio has some cash cows and some question marks. The cash generated from the cash cows can be used to invest in the question marks, so securing the long-term future of the company.