
Effect of Information Technology on Strategic Management Accounting

1 A performance-focused data science process
For a data or analytical model question, follow the decision chain: management objective - relevant and representative data - method and assumptions - validation and error costs - interpretation - action - monitoring and controls. Challenge missing data, bias and unjustified claims of causation.
Do not describe every data concern as ethical. Separate ethical issues such as informed consent, purpose, fairness and exploitation from security risks such as unauthorised access, and from commercial concerns such as customer reaction. Explain the affected stakeholder and the likely consequence.
Data science uses data, analytical techniques and technology to produce insights that support decisions. In APM the starting point is not the software or the volume of data: it is the organisation's objective and the decision that management must make.
1.1 Define the goal
State the business problem, the user of the analysis and the action that could follow. Translate the strategic objective into suitable performance questions and measures. For example, “reduce customer loss” is more useful when converted into a question such as “which customers are most likely to leave in the next three months, and what intervention is economically justified?”
1.2 Select the data
Identify relevant internal and external data. Consider structured data, such as transactions and customer records, and unstructured data, such as text, images, video and voice recordings. More data is not automatically better: it must be relevant, reliable, timely and legally obtainable.
Selection bias can arise if the data excludes an important group. For example, analysing only complaints submitted through an app may exclude customers who cannot or do not use the app.
1.3 Clean the data
Cleaning may involve removing duplicates, correcting obvious errors, handling missing values, standardising dates and units, reconciling sources and investigating outliers. The treatment should be documented. Deleting every unusual observation may remove genuine evidence of fraud, service failure or a new market trend.
1.4 Transform and integrate the data
Data may need to be combined, classified, aggregated or converted into useful variables. Examples include calculating customer lifetime, grouping products, converting currencies and deriving delivery delay from order and receipt dates. Definitions must be consistent across the organisation.
1.5 Store and govern the data
Storage should provide appropriate access, security, backup, retention and audit trails. A data warehouse can bring governed data together for reporting; a data lake may retain large quantities of data in a more flexible form. Whichever approach is used, ownership, definitions, quality standards and retention periods must be clear.
1.6 Analyse and model
The method should fit the goal:
descriptive analysis explains what has happened;
diagnostic analysis investigates why it happened;
predictive analysis estimates what is likely to happen; and
prescriptive analysis recommends a course of action.
1.7 Evaluate, communicate and act
Assess whether the result is accurate enough, unbiased, understandable and useful for the original decision. Communicate conclusions, uncertainty and limitations in language the decision maker can understand. After implementation, monitor the action and the model because relationships and data can change.

2 Regression analysis
Regression analysis estimates the relationship between a dependent variable and one or more explanatory variables. A simple linear regression can be written as:
y = a + bx
where y is the predicted dependent variable, x is the explanatory variable, a is the intercept and b is the estimated change in y for a one-unit change in x.
A fitted relationship is:
Sales revenue ($000) = 120 + 4.5 × advertising expenditure ($000)
If advertising expenditure is $20,000, predicted sales revenue is:
120 + (4.5 × 20) = $210,000
The slope suggests that an additional $1,000 of advertising expenditure is associated with $4,500 of sales revenue within the observed range. It does not, by itself, prove that advertising caused the increase.
If R² is 0.72, the model explains 72% of the variation in sales in the sample. The remaining variation may reflect other factors or random variation. A high R² does not prove causation or guarantee reliable forecasts.
2.1 Assessing a regression result
Is the sign and size of each coefficient plausible?
Is the relationship statistically and commercially significant?
Is the model being used within the range of the original data?
Are there outliers, non-linear relationships or changing conditions?
Have important explanatory variables been omitted?
Do residuals reveal a systematic pattern?
Does the model perform well on data that was not used to fit it?
Correlation measures association, not causation. A third factor may drive both variables, or the apparent relationship may be accidental.
3 Machine learning and performance management
Machine learning allows a system to identify patterns in data and improve predictions or classifications without every rule being explicitly programmed. It is a branch of artificial intelligence.
Supervised learning uses labelled examples, for instance historic customers identified as retained or lost.
Unsupervised learning searches for patterns or groups without a predetermined label, for example customer segments.
Applications include demand forecasting, predictive maintenance, fraud detection, credit assessment, customer churn prediction and analysis of text or voice sentiment.
Machine learning can process large and complex data, but it can also reproduce bias, overfit past data, become difficult to explain and deteriorate as conditions change. Human judgement remains necessary, particularly where a result affects people or a significant strategic decision.
4 Assessing and refining data-model outputs
A technically sophisticated model has no value if it does not support the organisation's goal. Management should assess:
relevance – does the output answer the original performance question?
accuracy – how large and costly are errors, including false positives and false negatives?
robustness – does it work with new data and under different conditions?
bias and fairness – are any groups systematically disadvantaged?
explainability – can users understand the important drivers and limitations?
timeliness and cost – is the result available when needed and worth producing?
Refinement may require correcting data, collecting more representative observations, changing variables, simplifying the model, adjusting parameters or thresholds, and retraining it. Results should be compared with actual outcomes. Data drift and model drift should be monitored, and material decisions should have an audit trail and appropriate human approval.
4.1 Illustration: churn model
A model identifies 1,000 customers as likely to leave. Only 80 actually leave, while it misses 60 other customers who leave. Management should not simply report “92% of flagged customers retained”. It should examine the false-alert rate, the cost of incentives given unnecessarily, the value of customers missed and whether the training data is representative. The intervention threshold should be refined using the economic consequences of both types of error.
5 Systems and data security
Performance information must preserve:
confidentiality – information is available only to authorised users;
integrity – information is complete, accurate and protected from unauthorised change; and
availability – systems and information are accessible when required.
5.1 Principal risks
phishing, weak passwords, stolen credentials and excessive access rights;
malware, ransomware and denial-of-service attacks;
unpatched systems, insecure interfaces and unauthorised devices;
employee error, deliberate manipulation and loss of equipment;
corruption, deletion or unavailability of data;
failure of cloud or outsourced providers; and
breach of privacy, retention or cross-border data requirements.
5.2 Controls
multi-factor authentication, strong access controls and least privilege;
regular review of user accounts and prompt removal of leavers' access;
encryption in transit and at rest, secure configuration and patching;
firewalls, anti-malware, monitoring and tested incident-response procedures;
input validation, reconciliations, version control and audit trails;
segregation of duties and independent approval of sensitive changes;
regular, protected backups and tested disaster-recovery arrangements;
staff awareness training and simulated phishing exercises; and
due diligence, contractual requirements and assurance over third parties.
Controls should be proportionate to risk and should be tested rather than merely documented. Management should receive measures such as critical incidents, time to detect and recover, unresolved high-risk vulnerabilities, access-review exceptions, backup restoration success and security training completion.
6 Ethical and governance issues
Data use should be lawful, transparent and consistent with the purpose for which the data was obtained. Management should consider consent, privacy, ownership, bias, explainability, accountability and the consequences of error. Collecting data simply because it is technically possible may damage trust and reputation.
Exam focus: apply the process to the scenario. Identify what management is trying to achieve, evaluate the suitability of the data and model, explain the business consequences of limitations, and recommend practical improvements and controls.Introduction
This chapter considers the impact of IT on management accounting. There is a lot of terminology, which may or may not be already familiar to you. You are unlikely to be tested on specific terminology, but you should be aware of the various items listed in this chapter.
7 Information needs of traditional manufacturing businesses
Manufacturing businesses need information areas:
Costs: material, labour overheads
Efficiency
Orders
Inventory (raw material, work-in-progress, finished goods)
Quality
Major customers and their buying habits
Sales by product, customer, season, country
Time for the manufacturing process to allow scheduling
Resources
Competitors’ products and prices
Innovation: new products being developed
8 Service oriented businesses
The nature of what is provided by service orientated businesses is often different to what manufacturing businesses provide in the following respects:
Heterogeneity: manufacturing often produces many identical units; service industries often produce tailored products eg an audit. Costing information and efficiency measurement will be quite different. Pricing will be very different as customer (or clients) will find it more difficult to judge prices.
Perishability: many services are perishable ie they lose their value after a certain time. An example is airline seats: once the aircraft departs the seats have no value. Again, this presents interesting pricing challenges. Performance will be improved by attracting each extra passenger at the maximum marginal price, but if everyone knows that prices will fall near the departure date, passengers will be encouraged to postpone booking until prices reduce.
Intangibility: it is difficult to show potential customer what they will get for their money. Auditing firms cannot show clients an audit or audit file so how can potential clients judge value for money?
Simultaneity: in manufacturing, production and sale can be separated. This allows products to be quality checked before dispatch and allow flexibility in timing. For example, production can be carried out steadily throughout the year and inventory can be stored until busy sales periods. Services cannot be stored and are often instantly delivered. This places additional demands on scheduling, pricing and quality control information
No transfer of ownership. Often services or the use of a service provider is for a limited period of time. Pricing and demand information has to reflect this. For example, the pricing of hotel rooms will vary from week-days to weekends. In addition because a service is being provided for a limited period only, consumers are likely to be very demanding during that period.
The information needed to perform well when providing a service will often be more related to qualitative than quantitative aspects. For example, reputation, customer satisfaction, availability of the service when required,
9 Instant access to data
IT has made it possible to access data and information instantly. This should mean that delays between events, processing the results of those events and feedback to alter future events should be much shorter. With manual accounting systems it took significant time to collect and process results, prepare reports and for those reports to be distributed to managers. Now is common for managers to have daily update on events (for example sales of many different products in supermarkets) and to take action to improve performance much more quickly. Indeed this can often be in real time. For example, as a particular airline flight receives bookings, air fares can be changed many times per day to try to maximize the marginal revenue that can be earned.
You should be aware of the following terminology:
Databases: large amounts of data are held in a way that allows many diverse users to access the data and to update it. Every will see the data in the same state ie it is consistent. Controls are needed to ensure that the data is held securely and confidentially.
Data warehouse: a vast amount of data. For example, supermarkets recording every loyalty card owner’s purchases.
Data mining: searching through a data warehouse in the hope of finding information of use – particularly unexpected useful information.
Groupware: allows users to collaborate. An example is Lotus Notes.
Internet: gives access to websites. Searches can be made on keywords (eg using Google) to find sites that might be of use.
Intranets: an internal internet. Very useful for distributing information within an organisation
Extranets: an organisation’s intranet given access to another’s intranet.
ERP (Enterprise resource planning).
A system that integrates internal and external management information across an entire organisation, including: finance/accounting, manufacturing, sales and service, customer relationship management, etc. ERP systems automate these activities with an integrated software application and they facilitate the flow of information between all business functions of the organisation.
MIS: (Management information systems).
Used for structured decision- making ie where there is a correct answer.
DSS: (Decision support system).
Helps managers to cope with unstructured decisions such as what should next year’s budget show. Spreadsheets are a good example.
EIS: (Executive information systems).
Used by top management. Flexible with the ability to ‘drill down’ to more and more detailed information. Access to external information is essential at this level.
ES: (Expert systems).
These can make decisions that replicate the decisions an expert would make. They rely on extracting knowledge from the expert and storing this in a knowledge base. Situations can then be presented to the system which uses the knowledge base to come to a conclusion or recommendation.The type of data needed depends on the management level:
Management level | Characteristics of the information |
|---|---|
Strategic | Highly summarised |
Tactical | A mix of the characteristics of strategic and operational |
Operational | Very detailed |
10 Customer relationship management software
Firstly, what’s mean by relationship management and marketing? A useful distinction can be drawn between:
Transaction marketing, and
Relationship marketing.
Transaction marketing focuses on the product, and develops the marketing mix (product, price, position, and place) according to the needs customers satisfy when they buy the product. However, this approach looks at one transaction at a time. You may well have developed a product which suits a particular segment of the market, but that doesn’t mean that you build that segment of the market into a loyal following.
Relationship marketing goes further. It seeks to attract, maintain, and enhance customer relationships by focusing on the whole satisfaction experienced by the customer when dealing with the firm. It’s not satisfied simply with one-off transactions, one-off sales. It wants ongoing close relationship with the customer.
It is aimed at:
Acquiring customers
Retaining customers
Extending customers i.e. sell more, sell related products or sell more expensive products (up-selling).
What customer relationship management software does can best be illustrated by an example.
A client rings up and the incoming caller number is recognised and it brings up to customer’s details on the screen. Those details show the name, address, telephone number of the customer and also the main personnel with whom we deal. It will give the job title of these people and may give their spending authorities. It may also contain information about their likes, dislikes and interests so it is possible to make relatively easy conversation with them. It will show a history of the products bought: the name of the product, the date of the purchase, the amount paid. This would be extremely useful, let’s say, in a software company allowing it to suggest an upgrade which is now available for some products that the client had.
It will also contain a diary where a summary of previous conversations can be noted. It gives the client the impression that the company they are dealing with is well-organised. If you can look at the diary and know that the client phoned up last week with this query, then that’s definitely impressive. It’s not at all impressive if the client has to explain yet again why they are phoning. You can also set alerts if you promised to ring the client back next week. How else are you going to remember it?
The emphasis here is on building a relationship, making the client believe that you know them, that you know the products they have, and the problems they have. It can be use for e-marketing and e-commerce. It can allow sales to be automated and certainly gathers very valuable information about the client. It’s very effective communication within the company. It doesn’t matter who answers the phone, if relevant information about the client is brought up, it gives the client the impression that they are dealing with a joined-up company. Finally, it’s a very important mechanism for knowledge management. At a very simple level, we are simply noting down conversations with the client and this is available to everybody in the organisation.
11 Cloud computing
In traditional client-server networks each client (the users’ machines on their desks) would have had a copy of, say, Word for Windows. Documents would have been downloaded from the server for local editing then saved back to the server. The disadvantage of this is that each machine in the network needs a copy of Word. Not only was this initially expensive, but if the company were upgrading its software all copies of the program had to be changed. Inevitably different machines ended up with different software versions.
Furthermore, all the client machines have to be powerful enough to run all applications – even if powerful computing were only needed occasionally.
With cloud computing, this approach has changed. There is only one copy of the software on the server within a web-based interface. Users log into the web system and their processing is then carried out on the server or a ‘cloud’ of servers. It appears to each user that they have a local version of the software, but what they are really seeing is the program operating in the server. As more processing is needed more cloud resources can be used and this gives users great flexibility.
Client machines can be ‘thin-clients’ (ie not powerful) as they do not have to store much data and software nor do they have to carry out much processing. Hardware, software and maintenance costs are greatly reduced, though the system is vulnerable to service disruption. For example, relatively simple machines, even laptops, can be used for highly demanding graphical work. The laptop acts as an interface, receiving commands from the operator and displaying results. However, all the very complex and power-hungry computing is done on a remote, cloud-based computer.
Hotmail and Gmail provide examples of cloud technology. Whenever you want to write an email you log into the web email account and the processing is carried by the system’s computer cloud – not your computer. All it has to do is to handle the interface.
12 Remote input of data
Traditionally, data was input into the computer systems using a keyboard. This takes time, and inevitably results in input errors.
IT has enabled more and more data to be input remotely and/or automatically. You should be aware of the uses of the following:
Laptop/notebook computers often with WiFi or 3G (or 4FG) connectabiity allow sales personnel to contact head office to check on inventory and to enter new orders.
Handheld devices (including smartphones and iPads) can be used to input inventory counts and update production statistics
Barcodes (standard super-market technology)
RFID tags (radio frequency identification tags). RFID tags are tracking consumer products worldwide. Many manufacturers use the tags to track the location of each product they make from the time it's made until it's pulled off the shelf and tossed in a shopping cart.
13 The need for continual development
However well a management accounting system has been designed, it is vitally important that it is continually re-appraised, refined and developed if a business is to maintain or improve its performance.
The marketplace is increasingly competitive and increasingly global, creating different information needs for management.
14 Big Data
There are many definition the term ‘big data’ but most suggest something like the following:
“Extremely large collections of data (data sets) that may be analysed to reveal patterns, trends, and associations, especially relating to human behaviour and interactions.”
In addition, many definitions also state that the data sets are so large that conventional methods of storing and processing the data will not work.
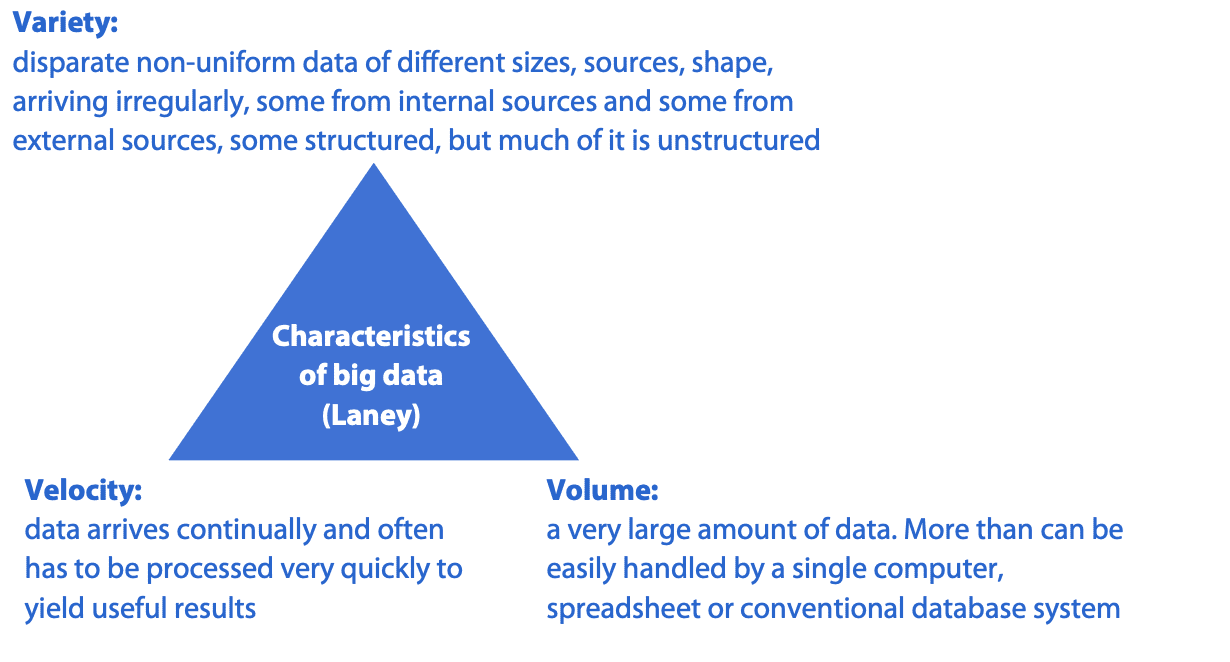
In 2001 Doug Laney, an analyst with Gartner (a large US IT consultancy company) stated that big data has the following characteristics, known as the 3Vs:
Volume
Variety
Velocity
These characteristics, and sometimes additional ones, have been generally adopted as essential qualities of big data.
The commonest fourth ‘V’ that is sometimes added is veracity: Is the data true? Can its accuracy be relied upon?
14.1 Volume
The volume of big data held by large companies such as Walmart (supermarkets), Apple and EBay is measured in multiple petabytes. What’s a petabyte? It’s 1015 bytes (characters) of information. A typical disc on a personal computer (PC) holds 109 bytes (a gigabyte), so the big data depositories of these companies hold at least the data that could typically be held on 1 million PCs, perhaps even 10 to 20 million PCs.
These numbers probably mean little even when converted into equivalent PCs. It is more instructive to list some of the types of data that large companies will typically store.
Retailers
Via loyalty cards being swiped at checkouts: details of all purchases you make, when, where, how you pay, use of coupons. Via websites: every product you have every looked at, every page you have visited, every product you have ever bought. (To paraphrase a Sting song “Every click you make I’ll be watching you”.)
Social media (such as Facebook and Twitter)
Friends and contacts, postings made, your location when postings are made, photographs (that can be scanned for identification), any other data you might choose to reveal to the universe.
Mobile phone companies
Numbers you ring, texts you send (which can be automatically scanned for key words), every location your phone has ever been whilst switched on (to an accuracy of a few metres), your browsing habits. Voice mails.
Internet providers and browser providers
Every site and every page you visit. Information about all downloads and all emails (again these are routinely scanned to provide insights into your interests). Search terms you enter.
Banking systems
Every receipt, payment, credit card payment information (amount, date, retailer, location), location of ATM machines used.
14.2 Variety
Some of the variety of information can be seen from the examples listed above. In particular, the following types of information are held:
Browsing activities: sites, pages visited, membership of sites, downloads, searches
Financial transactions
Interests
Buying habits
Reaction to ads on the internet or to advertising emails
Geographical information
Information about social and business contacts
Text
Numerical information
Graphical information (such as photographs)
Oral information (such as voice mails)
Technical information, such as jet engine vibration and temperature analysis
This data can be both structured and unstructured:
Structured data: this data is stored within defined fields (numerical, text, date etc) often with defined lengths, within a defined record, in a file of similar records. Structured data requires a model of the types and format of business data that will be recorded and how the data will be stored, processed and accessed. This is called a data model. Designing the model defines and limits the data that can be collected and stored, and the processing that can be performed on it.
An example of structured data is found in banking systems, which record the receipts and payments from your current account: date, amount, receipt/payment, short explanations such as payee or source of the money.
Structured data is easily accessible by well-established database structured query languages.
Unstructured data: refers to information that does not have a pre-defined data-model. It comes in all shapes and sizes and this variety and irregularities make it difficult to store it in a way that will allow it to be analysed, searched or otherwise used. An often quoted statistic is that 80% of business data is unstructured, residing it in word processor documents, spreadsheets, PowerPoint files, audio, video, social media interactions and map data.
14.3 Velocity
Information must be provided quickly enough to be of use in decision making. For example, in the above store scenario, there would be little use in obtaining the price-comparison information and texting customers once they had left the store. If facial recognition is going to be used by shops and hotels, it has to be more-or less instant so that guests can be welcomed by name.
You will understand that the volume and variety conspire against the third, velocity. Methods have to be found to process huge quantities of non-uniform, awkward data in real-time.
Software for big data
Without getting too technical on this issue, a library of software known as Apache Hadoop is specifically designed to allow for the distributed processing of large data sets (ie big data) across clusters of computers using simple programming models. (Clusters of computers are needed to hold the vast volume of information.) Hadoop is designed to scale up from single servers to thousands of machines, each offering local computation and storage.
The processing of big data is generally known as big data analytics and includes:
Data mining: analysing data to identify patterns and establish relationships such as associations (where several events are connected), sequences (where one event leads to another) and correlations.
Predictive analytics: a type of data mining which aims to predict future events. For example, the chance of someone being persuaded to upgrade a flight.
Text analytics: scanning text such as emails and word processing documents to extract useful information. It could simply be looking for key-words that indicate an interest in a product or place.
Descriptive analytics: looks at data to analyse what happened in the past. This will help an organisation to understand how it is performing. For example, comparison with previous years or with competitors, graphs and dashboards.
Diagnostic analytics: analyse descriptive analytics to determine “Why did this change occur?” For example, the descriptive analytics might show a fall in sales and then the diagnostic analytics might be able to explain the effect by correlating this to a fall in total consumer demand or by identifying that the fall in demand was experienced only by our organisation. Further, it would attempt to explain why our products were less favoured than competitors’. Was it price? Was it design and innovation? Was it because of after sales service?
Prescriptive analytics: data analysis that goes beyond describing past events or predicting future ones. The aim is to provide recommendations that can be adopted by an organisation to maximise the chance of achieving a desired outcome.
Video analytics: analyses, for example, customers’ behaviours in stores. Which displays caused customers to look and linger? Which were almost ignored?
Sentiment analysis: this studies the subjective information in text: opinions, appraisals, emotions, or attitudes towards a topic, person, product or place. Expressions can be classified as positive, negative, or neutral. For example, a review stating that a product is good/no good.
Voice analytics: as above with audio.
Statistical analytics: used to identify trends, correlations and changes in behaviour.
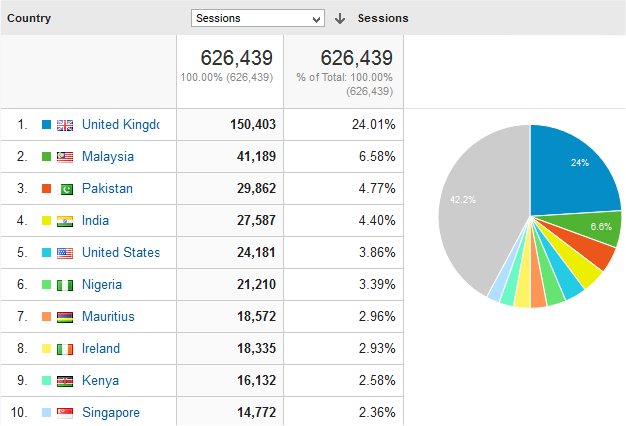
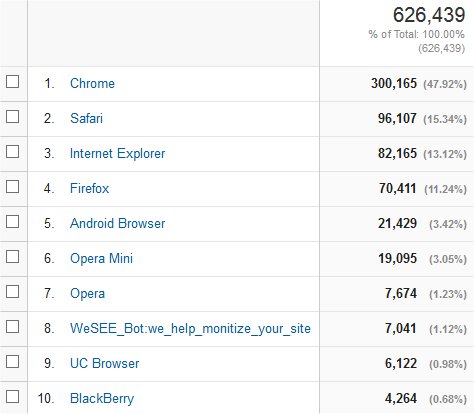
Google provides web-site owners with Google Analytics that will track many features of web-site traffic. For example, Google analytics on the OpenTuition.com reports statistics such as the following:
Geographical distribution of users:
Type of browser used
Age of user
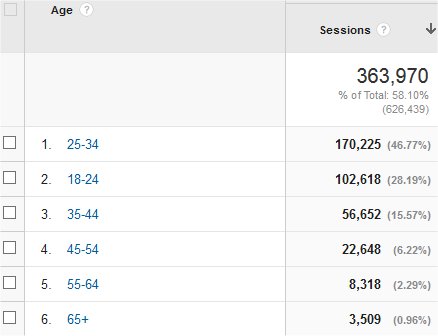
The final table is instructive. OpenTuition.com does not ask for users’ ages, so this data has been pieced together from other information available to Google; it has been able to do this for only about 58% of users.
The analytical findings can lead to:
Better marketing
Better customer service and relationship management
Increased customer loyalty
Increased competitive strength
Increased operational efficiency
The discovery of new sources of revenue.
Dangers of big data
Despite the examples of the use of big data in commerce, particularly for marketing and customer relationship management, there are some potential dangers and drawbacks.
Cost: It is expensive to establish the hardware and analytical software needed, though these costs are continually falling.
Regulation: Some countries and cultures worry about the amount of information that is being collected and have passed laws governing its collection, storage and use. Breaking a law can have serious reputational and punitive consequences.
Loss and theft of data: Apart from the consequences arising from regulatory breaches as mentioned above, companies might find themselves open to civil legal action if data were stolen and individuals suffered as a consequence.
Incorrect data (veracity): If the data held is incorrect or out of date incorrect conclusions are likely. Even if the data is correct, some correlations might be spurious leading to false positive results.
Employee monitoring: data collection methods allow employees to be monitored in detail every second of the day. Some companies place sensors in name badges so that employee movements and interactions at work can be monitored. The badged monitor to whom each employee talks and in what tone of voice. Stress levels can be measured from voice analysis also. Obviously, this information could be used to reduce stress levels and to facilitate better interactions but you will easily see how it could easily be used to put employees under severe pressure.
15 Lean information systems
Lean methodology is a way of optimizing the use of people, resources, effort, and energy so as to create value for customers. A simple example would be to eliminate pointless movements of inventory around a factory – or even to eliminate most inventory altogether. Although lean methodologies were developed to deal with manufacturing, the principles can also be applied to management information systems.
The tools or steps for a lean system are often described by the 5S model which is:
S | Meaning in the context of management information systems |
Sort | What is needed and what is not useful? Remove reports and information that are not used. |
Set in order (or simplify) | Set In Order focuses on creating efficient and effective storage methods to arrange information so that it is easy to use and to label and describe the information in useful ways. If used infrequently make it available but not appearing on routine screens and reports. That just causes clutter. |
Shine (or scan) | Continually analyse who is using the information. Remove old records. Keep the data and information clean, tidy and relevant. Keep the information up-to-date. |
Standardise | For example, achieve consistency on how amounts are calculated, how data is presented, how often reports are produced, who receives the information and when. |
Sustain | Continually perform the four steps above. Achieving leanness is not a one-off exercise and the effort has to be sustained. |
16 Data silos
A data silo is a collection of data that is held by one department and which is not easily or fully accessible by other groups in the same organization.
Finance, sales, production, HR, marketing teams, and other departments need different information to do their work and, historically, those departments usually stored their data in separate locations (ie separate files or separate databases) known as data or information silos. The fragmentation of data into silos creates barriers to information sharing and collaboration across departments. In addition, if different departments have to hold the same data not only does that waste storage space but, more importantly, it takes care and effort to ensure that all copies of the same piece of data are updated consistently. Inevitably the various copies of the same data begin to diverge and become inconsistent.
Additionally, each department might hold data in their own ways so that it can be difficult to know if the data is about the same entity or a different one. For example, one department might record an employee’s name as J smith, another as John Smith and a third as Smith, J.
Data silos occur because of:
Technology
Different department often adopted different, possibly incompatible, technologies. A simple example is where one department records names and addresses on a word-processor and another uses a spreadsheet. It might be possible to merge the data but is takes effort and know-how.
Adopting database systems and big data methodologies will go a long way to overcoming these technological problems. In a database each piece of data is held only once (so is consistent for all users) and, with appropriate authorisation, everyone in the organisation can access any piece of data.
Company culture
In many organizations departments are accustomed to working on their own, looking after their own interests and they can see other departments’ demands as bothersome and even competitive. For example, if the sales department wants additional products to be manufactured so as to meet a new order, the production department could respond saying they had no resources when, in fact, they simply didn’t want to work harder. So, each department guards its data jealously because their data provide them with a control mechanism: information is power.
Once again, new technology, such as databases, can help, but it is also essential to ensure that departments are willing to work together and to cooperate. It’s all very well thinking that a database holds data available to all but what if a sales manager simply chose not to update the database with information about potential sales so that they could be booked in a later month instead perhaps to engineer a steady rate of sales growth?
17 Process automation and the internet of things
In process automation a whole process is automated, not just individual steps. For example, when you order goods on Amazon, once you click on ‘Buy’ the goods are automatically picked by machinery in the warehouse, brought together, packed and then despatched with very little human intervention. Similarly, car manufacturing allows different components to be automatically delivered to the production line so that the precise vehicles specified by customers can be made: engine size, trim, upholstery style, manual/automatic transmission, wheel style, clear or tinted windows and so on.
Process automation should allow:
Greater flexibility to respond to customers’ orders
Cheaper production or service delivery
Greater reliability as there is less opportunity for human error
Faster production because of the meticulous co-ordination needed.
Process automation will often use robotic machinery not only to process material in manufacturing but also in to move raw materials, components and finished goods around warehouses.
Custom manufacturing and 3D printing (additive manufacturing) is also used in process automation. Instead of drilling holes in a piece of metal or cutting it to shape, in 3D printing material (plastic or metal powder) is gradually built up. The process is automated allowing the quick production of prototypes or one-off components.
Processes automation is do not confined to physical operations. For example, banks nearly all use process automation when you ring them, often involving voice recognition. So, you can ask about your balance, report a lost or stolen card, query a payment, order documentation. You might have discovered that with some process automation banks have some way to go in making this automation wholly successful and satisfying for customers.
The Internet of things means that many devices are connected through the internet. For example:
You can use your phone to switch on your heating system when you come in and go out.
Smart locks on doors that you can unlock using an App.
Shops can message you asking for feedback after you visit them.
Inventory and deliveries can be tracked in real time using RFID tags (radio frequency identification tags)
18 Artificial intelligence (AI)
Artificial intelligence allows machines to learn and to make deductions based on data supplied. For example, playing games such as Go, facial recognition, predicting customer purchasing requirements and tastes, recommending music (like Pandora) that each consumer should like.
Note that in AI people are not programming machines’ responses: the machines are learning, uncovering patterns, trying out strategies and making decisions based on their learning.
Examples from business include:
Engineering: Rolls-Royce uses AI when designing new engines and also to monitor engines in flight so as to learn how to predict when maintenance or part replacement is needed.
Warehousing and distribution: AI improves demand prediction, picking, packing and working out efficient distribution routes.
Marketing: AI builds up patterns of consumers’ behaviour and can suggest items that are likely to be attractive to each customer.
Voice and face recognition: AI has allowed these technologies to become very reliable.
Law and accountancy: Lawyers perform due diligence to uncover background information, contract review, legal research and electronic discovery (eg searching through vast numbers of emails). Forecasting the likely outcome of litigation. Auditors use AI to examine transactions to identify those which appear to be incorrect or which might imply fraud.
A ‘black box algorithm’ is the name given to any artificial intelligence system where operations are not visible or discernible to the user. For example, some companies use AI to shortlist job applicants. If it is not clear how the algorithm makes its assessments and decisions then it is a black box algorithm, an impenetrable system.
When artificial intelligence is used to develop the rules for an algorithm then this autonomous process will result in systems that are difficult for humans to understand and analyse. Questions such as “Why has the system make this decision?” are likely to be unanswerable. When this occurs errors and bias can be present in the system which are then not easily detectable by humans.
AI bias can be introduced to algorithms as a result of the conscious or unconscious prejudices of the developers, or they can they can be created by undetected errors in the AI process.
For example, to develop AI for recruitment a company might supply the system with details of current and previous employees and their success in the business. However, if most staff were historically male and young (typical in IT jobs) then the resultant AI decisions could well be biased against the recruitment of female or older applicants.
The ethical dangers are obvious.