
Ratio analysis

1 Groups of ratios
There are several groups of financial ratios:
Profitability
Efficiency
Liquidity
Gearing
Investment ratios
You must learn the various ratios and it is important that you are able to discuss briefly the relevance of the various ratios, and also their limitations.
Very few of the ratios mean much on their own – most are only useful when compared with the ratios for previous years or for similar companies.
Many of the ratios use figures from the Statement of Financial Position. These only represent the position at one point in time, which could be misleading. For example, the level of receivables could be unusually high at the year end, simply because a lot of invoicing was done just before the year end. Perhaps more sensible in that sort of case would be to use the average for the year. Normally in the examination you will be expected simply to use Statement of Financial Position figures at the end of the year, but do be prepared to state the problem if relevant.
2 Profitability ratios
Gross profit is the ‘main-spring’ of profit generation. If gross profit stays high, but net profit falls, this can imply that expenses are poorly controlled.
Two confusions in these profitability ratios are punished heavily. Profit and profit margin are different measures, so a target expressed as a margin cannot be judged by the percentage change in profit — work out the margin for each year and compare those. And both the margin and return on capital employed here use profit before interest and tax, so interest charges do not explain a fall in them; interest belongs to the gearing and interest cover ratios lower down. Remember also that quoting a percentage change is not analysis: the reader can already see the figures, so the marks are for the reason for the movement and its consequences.
(Long-term capital = share capital + reserves + long-term liabilities)
Asset turnover measures how hard the assets are worked: $ of revenue from each $ of capital.
NB: ROCE = asset turnover × net profit margin
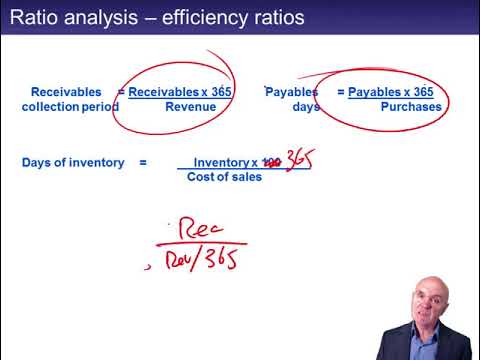
3 Efficiency ratios
Too high can indicate inefficient use of inventory, or inventory that won’t sell.
Long collection periods might indicate inefficient receivable management – or agreeing longer credit to compete or win contracts.
4 Liquidity ratios
If too low, the organisation will have trouble paying its suppliers and employees on time.
5 Gearing
The higher the gearing ratio, the greater the danger that interest cannot be paid. The lower the interest cover, the greater the danger that interest cannot be paid.
6 Investor ratios
Different economic sectors tend to have different characteristic P/E ratios. The price/share is the current price, but the earnings per share is the EPS from the last financial statements. If the P/E is higher than expected for a sector, it means that shareholders are optimistic about earnings growth and are willing to put a relatively high price on the share. If a company’s P/E ratio is low for its sector, investors are pessimistic about future earnings.
Shareholders like to see this increase. It can decrease when new issues are made and the capital raised hasn’t yet produced profits.
Paying too much for an acquisition (for example by a share exchange) can depress the EPS