
Financial Performance Measurement

1 Introduction
Financial statements are prepared to assist users in making decisions. They therefore need interpreting, and the calculation of various ratios makes it easier to compare the state of a company with previous years and with other companies.
In this chapter we will look at the various ratios that you should learn for the examinations.
2 The main areas
When attempting to analyse the financial statements of a company, there are several main areas that should be looked at:
Profitability
Liquidity
Gearing
The importance of each area depends on whose behalf that we are analysing the statements.
We will work through an example to illustrate the various ratios that you should learn under each heading.
3 Worked example
Statements of Financial Position as at 31 December
2007 | 2006 | |||
$ | $ | $ | $ | |
ASSETS | ||||
Non-current assets | ||||
Tangible assets | 1,341 | 826 | ||
Current assets | ||||
Inventory | 1,006 | 871 | ||
Trade receivables | 948 | 708 | ||
Cash | 360 | 100 | ||
2,314 | 1,679 | |||
TOTAL ASSETS | 3,655 | 2,505 | ||
LIABILITIES AND CAPITAL | ||||
Capital and reserves | ||||
$1 ordinary shares | 1,200 | 720 | ||
Retained profit | 990 | 681 | ||
2,190 | 1,401 | |||
Non-current liabilities | ||||
10% loan 2015 | 500 | 400 | ||
Current liabilities | ||||
Trade payables | 653 | 516 | ||
Tax payable | 228 | 140 | ||
Dividends payable | 84 | 48 | ||
965 | 704 | |||
TOTAL LIABILITIES AND CAPITAL | 3,655 | 2,505 |
Statement of Profit or Loss for the year ended 31 December
2007 | 2006 | ||
$ | $ | ||
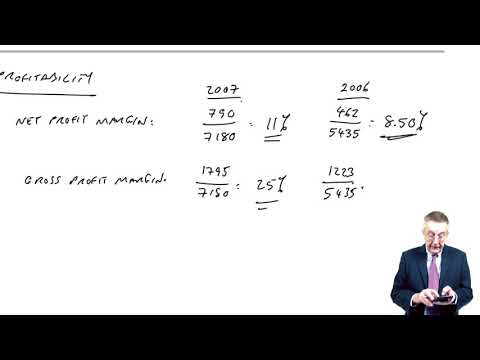
Revenue | 7,180 | 5,435 | |
Cost of sales | 5,385 | 4,212 | |
Gross profit | 1,795 | 1,223 | |
Distribution costs | 335 | 254 | |
Administrative expenses | 670 | 507 | |
Profit from operations | 790 | 462 | |
Finance costs | 50 | 52 | |
Profit before taxation | 740 | 410 | |
Company tax expense | 262 | 144 | |
Profit after taxation | 478 | 266 | |
Dividends | 169 | 95 | |
Retained profit for the period | 309 | 171 |
You are required to calculate the profitability, liquidity and gearing ratios
Profitability
(= capital + reserves + long-term liabilities)
NB: ROCE = asset turnover × net profit margin
Liquidity
Gearing
4 Limitations of ratio analysis
You must learn the various ratios, however, it is important that you are able to discuss briefly the relevance of the various ratios, and also their limitations.
Very few of the ratios mean much on their own – most are only useful when compared with the ratios for previous years or for similar companies.
Many of the ratios use figures from the Statement of Financial Position. These only represent the position at one point in time, which could be misleading. For example, the level of receivables could be unusually high at the year end, simply because a lot of invoicing was done just before the year end. Perhaps more sensible in that sort of case would be to use the average for the year. Normally in the examination you will be expected simply to use Statement of Financial Position figures at the end of the year, but do be prepared to state the problem if relevant.
Take the profit the ratio asks for: an operating margin and ROCE both use profit before interest and tax, so tax deducted in the statement has to be added back. Then use the comparatives the question gives — the prior year, the other division, the company average — and say which is performing better, and why.
Financial performance measurement
10 questionsAnswer the questions one at a time. Your progress is saved so you can leave and come back.
Open chapter practice