
Current Developments in Management Accounting

In environmental-cost questions, calculate on the requested time basis and justify each classification. Do not confuse lifecycle costing with the product lifecycle. Keep ABC and ABM distinct: ABC identifies activity costs and drivers; ABM uses that information to improve activities and performance.
1 Value-based management
Value-based management (VBM) is an approach that aligns strategy, decisions, processes and rewards with the creation of long-term value. It asks whether an activity earns a return above the full cost of the capital committed to it, while recognising the operational and stakeholder drivers needed to sustain that value.
A VBM answer should connect operational drivers to cash flow, capital employed, risk and sustainable value. Calculate the capital charge or economic profit where data permits, assess the existing measures and explain the practical organisational changes required. A definition of VBM is only a starting point.
1.1 Value creation
Accounting profit can increase even when a project fails to compensate investors for risk. VBM therefore uses value measures and the underlying drivers of value. One possible measure is economic profit:
Economic profit = net operating profit after tax – (capital employed × cost of capital)
1.2 Illustration
A business earns net operating profit after tax of $3.6 million and uses capital of $24 million. Its cost of capital is 12%.
Capital charge = $24m × 12% = $2.88m
Economic profit = $3.60m – $2.88m = $0.72m
The business has created $0.72 million above the return required by providers of capital. A positive figure for one year is encouraging, but management must consider whether it is sustainable.
1.3 Value drivers
Senior financial measures are too remote to guide every operational decision. Management should identify a value-driver tree that links operational actions to value. Drivers may include revenue growth, price, customer retention, operating margin, working-capital days, asset utilisation, tax, investment, risk and the duration of competitive advantage.
For example, improved on-time delivery may increase retention; retention may increase revenue and customer lifetime value; higher and more stable cash flows may increase business value. The chosen measures should make these links visible without claiming causation where evidence is weak.
1.4 Implementing VBM
clarify the organisation's purpose and definition of long-term value;
identify the few strategic and operational drivers with the greatest impact;
set targets and allocate resources using those drivers;
make managers accountable only for factors they can influence;
align incentives with long-term results and risk; and
review whether decisions and actual outcomes created the expected value.
VBM can improve strategic focus and capital allocation. Its limitations include sensitivity to forecasts and the cost of capital, difficulty measuring intangible assets, and the risk of treating shareholder value as the only objective. Short-term reductions in training, maintenance or environmental expenditure may improve current profit but destroy long-term value.
2 Environmental cost categories
Environmental costs are often dispersed across overheads and may therefore be overlooked. A useful classification is:
Conventional costs – normal costs of materials, energy, labour and equipment that also have an environmental consequence. Wasted material is both a purchasing cost and an environmental cost.
Hidden costs – costs buried in overheads, such as environmental monitoring, permits, reporting, training, inspection and waste handling.
Contingent costs – possible future costs whose amount or timing is uncertain, such as clean-up obligations, fines, legal claims and remediation.
Reputational costs – effects on revenue, recruitment, finance and stakeholder relationships caused by perceptions of environmental performance.
The categories prevent management from focusing only on visible disposal charges. Frequently the cost of material lost as waste is much greater than the cost of disposing of it.
2.1 Input-output analysis
Input-output analysis compares the physical quantity of resources entering a process with the quantity incorporated in saleable output. The difference is waste.
A process uses 10,000 kg of material costing $6 per kg. Saleable output contains 8,200 kg. Disposal costs $3 per kg of waste.
Waste = 10,000 kg – 8,200 kg = 1,800 kg
Material cost of waste = 1,800 kg × $6 = $10,800
Disposal cost = 1,800 kg × $3 = $5,400
Identified environmental cost = $16,200
The calculation is still incomplete if wasted material has also absorbed labour, energy or processing costs. Reducing waste by 500 kg would avoid $4,500 of material and disposal cost before considering those additional savings.
2.2 Activity-based environmental costing
Environmental overheads can be assigned to the activities that cause them rather than spread through a general overhead rate. Suitable cost drivers may include kilograms of hazardous waste, number of inspections, machine hours, emissions or number of product take-backs.
For example, if a $180,000 waste-handling cost pool is driven by 60,000 kg of waste, the rate is $3 per kg. A product causing 8,000 kg of waste is charged $24,000. This reveals the environmental cost of the product and supports pricing, redesign and process-improvement decisions.
2.3 Managing environmental performance
Relevant measures may include energy and water per unit, percentage of recycled input, waste and emissions per unit, compliance incidents, clean-up provisions and lifecycle impact. Measures should use consistent boundaries and should not reward shifting damage to a supplier, another country or a later stage of the product's life.
Environmental decisions should consider lifecycle costing, quality management, target costing and investment appraisal together. Benefits can include lower input cost, reduced risk, process innovation, improved reputation and stronger customer or employee relationships.
Exam focus: identify the full category of each cost, perform the physical and monetary calculation, explain what the current system hides, and recommend measures and actions that support strategy.Introduction
In this chapter we will look at a few modern ideas in management accounting. Some of them you will have seen before in your studies for Paper F5, but others are here for the first time.
3 Quality management
3.1 Definitions
Quality can be defined as:
“Fitness for use” (Juran)
Or
“ …the totality of characteristics…ability to satisfy customers’ stated or implied needs..” (ISO9000 handbook)
Quality control refers to the processes (such as sampling and testing) that an organisation employs to check on quality.
Quality assurance is the sum of the management allow an organisation to dependably achieve a stated level of quality
Quality management is the overseeing of all the activities needed to achieve and maintain the required quality. It includes establishing the required quality level, setting quality control procedures and also considering quality improvement
3.2 Costs associated with quality
Costs of conformance (i.e. of improving quality)
Prevention costs
Appraisal costs
Costs of non-conformance (i.e. of allowing poor quality)
Internal failure costs
External failure costs
Moving effort towards the top of this list should save costs. Hence the claim that ‘quality is free’
3.3 Total Quality Management (TQM)
TQM is defined as “the continuous improvement in quality, productivity and effectiveness obtained by establishing management responsibility for processes as well as outputs. In this, every process has an identified process owner and every person in an entity operates within a process and contributes to its improvement”.
Any manufacturing company will want to deliver goods to the customer that are of sufficiently high quality to avoid goods being returned. In order to check this, the company will have some form of quality control checks on goods leaving the factory. However, even though good quality control will result in poor quality goods being rejected, and therefore not reaching the customer, there remain the costs associated with waste and poor quality work.
It is therefore important that all possible steps are taken not only to check quality at each stage, but to design processes and educate the workforce to facilitate good quality production. If everything is done right first time, there will be no quality control problems and no waste of materials or time.
TQM does not apply only to the manufacturing system. It will also apply to phone answering, provision of information, the organisation’s web-site, order processing, invoicing, recruitment and training.
The implementation of TQM is never really complete and there is a culture within the organisation of continually achieving improvements. Often these are small, but nevertheless will add up to be significant. The process of a continuous series of small improvements is known as ‘Kaizen’.
3.4 Six sigma
Six sigma is an approach to quality control that was originally devised by Motorola, a high tech electronics company that manufactures, amongst other products, microprocessor chips. The aim of the company was to achieve very low rejection rates, < 3.4 defects/million, though that specific objective is not as important as their methodology, known as DMAIC: define, measure, analyse, improve, control.
Define: define what is meant by quality. For example, reliability, style, fast response, helpful service.
Measure Ways of measuring the quality factors have to be devised. For example, failure rate for reliability, customer surveys for style. Measure both current performance and use the measurement methods to better define what is meant by quality i.e. set targets.
Analyze Investigate why current performance falls short of required performance.
Improve Attempt to improve performance.
Repeat the D, M, A, I cycle until the required standards have been achieved.
Control Control is continuously applied to ensure, for example, that definitions are still relevant, that costs are within budget and that progress is being made.
DMAIC fits in with Kaizen ie a continuous series of improvements
4 Life-cycle costing
When seeking to make a profit on a product it is essential that the total revenue arising from the product exceeds total costs, whether these costs are incurred during the phases of design, manufacture, operation, end-of-life:
Phase | Examples of types of cost |
|---|---|
Design | Research, development, design, tooling |
Manufacture | Material, labour, overheads, machine set up, inventory, training, production machine maintenance, depreciation, and environmental costs |
Operation | Distribution, advertising, warranty claims |
End of life | Environmental clean-up, disposal, de-commissioning, |
There are four principal lessons to be learned from life-cycle costing:
All costs should be taken into account when working out the cost of a unit and its profitability.
Attention to all costs will help to reduce the cost per unit and will help an organisation achieve its target cost.
Many costs will be linked. For example, more attention to design can reduce manufacturing and warranty costs. More attention to training can reduce machine maintenance costs. More attention to waste disposal during manufacturing can reduce end-of life costs.
Costs are committed and incurred at very different times. A committed cost is a cost that will be incurred in the future because of decisions that have already been made. Costs are incurred only when a resource is used.
Typically the following pattern of costs committed and costs incurred is observed:
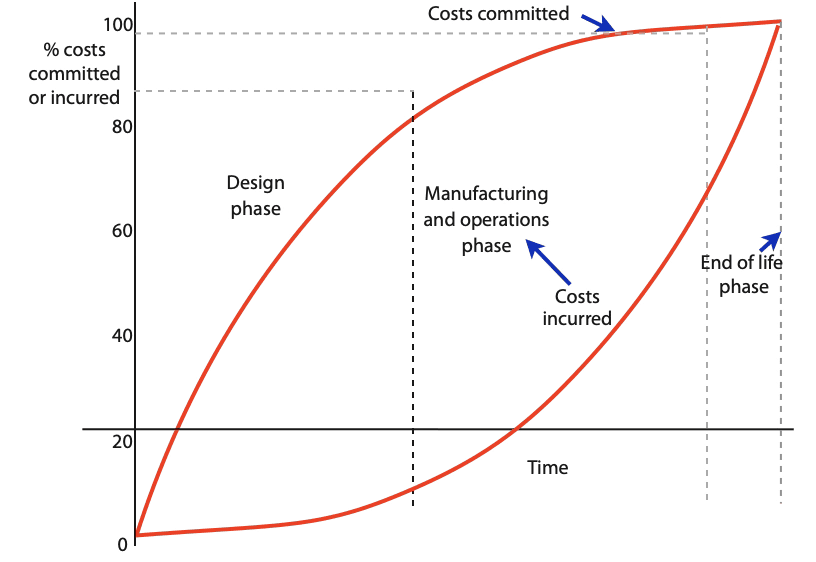
The diagram shows that by the end of the design phase approximately 80% of costs are committed.
For example, the design will largely dictate material, labour and machine and environmental costs. The company can try to haggle with suppliers over the cost of components but if, for example, the design specifies ten units of a certain component, negotiating with suppliers is likely to have only a small overall effect on costs. A bigger cost decrease would be obtained if the design had specified only eight units of the component. The design phase locks the company in to most future costs and it this phase which gives the company its greatest opportunities to reduce those costs.
Conventional costing records costs only as they are incurred, but recording those costs is different to controlling those costs and performance management depends on cost control, not cost measurement. Many costs in the manufacturing phase can only be controlled by what happened in the design phase.
5 Just-in-time ( JIT)
Traditionally, most manufacturing companies have considered it necessary to have a certain level of stock of raw materials, work-in-progress, and finished goods.
However, not only may this be costly in terms of physically holding the stock and in terms of the possibility of damage and obsolescence, but also the requirement to hold stock may be symptomatic of inefficiencies within the company.
For example, the level of work-in-progress is determined by the length of time of the manufacturing process. If the process can be streamlined and production time reduced, then the level of work- in-progress will be reduced but the company will make additional gains as a result of greater efficiency.
With a just-in-time approach, the focus is on allowing the demand to determine the production (‘demand-pull’ production). This results in greater customer satisfaction, savings resulting from greater efficiency, and savings resulting from the need to have lower stock levels.
5.1 Conventional reasons for keeping stocks:
Raw materials
To deal with production needs
To safeguard supplies
To take advantage of low prices
Some materials produced seasonally, so has to be purchased when available
To obtain bulk discounts
Work-in-progress
To have some partially made inventory that will allow fast completion
Technical reasons (eg production maturing, chemical processes that take time to complete).
Finished goods
To deal with variable demand
To enable instant supply (might be required by customers)
To hold goods at different locations to reduce delivery times
5.2 Main features of a just-in-time approach:
Very little (or no) inventory held.
A pull approach: inventory is ‘pulled in’ in response to orders received.
A very high degree of coordination is needed internally and with suppliers and customers. The management information system has to be very good
Reliable suppliers and transportation
Flexible suppliers
Supplies of high quality
Supplies available quickly (often implies that manufacturers have to be close to both their suppliers and customers).
Note that any disruption of the supply of raw materials and components quickly causes serious problems: no raw materials implies no production, implies an idle work-force and unhappy customers.
6 Target costing
Traditionally it has been the cost of producing an item that has driven the selling price – the first step was to estimate the production cost and then to decide on a selling price. However, this approach ignored the effect of the selling price on the demand for the product, and also gave no direct incentive to reduce costs. Target costing is a market driven approach and consists of the following steps:
From research of the market determine a selling price at which the company expects to achieve the desired market share – the target selling price.
Decide on the profit required (e.g. a required profit margin, or a required return on investment)
Calculate the maximum cost per unit in order to achieve the required profit – this is the target cost
Estimate the actual cost of production and compare with the target cost.
Packard plc are considering whether or not to launch a new product. The sales department have determined that a realistic selling price will be $20 per unit.
Packard have a requirement that all products generate a gross profit of 40% of selling price.
Calculate the target cost.
Show answerHide answer
Hewlett plc ia about to launch a new product on which it requires a pre-tax ROI of 30% p.a.. Buildings and equipment needed for production will cost $5,000,000.
The expected sales are 40,000 units p.a. at a selling price of $67.50 p.u..
Calculate the target cost.
Show answerHide answer
6.1 The use of the target cost
Once the target cost has been determined, it will be compared with the estimated actual cost of production. Any excess of the actual cost over the target cost is known as the target cost gap and the company will then be looking for ways of closing this gap.
Possible ‘solutions’ to the target cost gap:
Cheaper materials
Fewer features
Outsource to a cheaper producer
More efficient production eg longer production runs
7 Kaizen costing
Is the process of cost reduction during the manufacturing phase of an existing product. The Japanese word kaizen refers to continual and gradual improvement through small betterment activities, rather than large or radical improvement made through innovation or large investments in technology. Kaizen costing is most consistent with the saying “slow and steady wins the race.”
Whereas target costing is used during the design phase of a new product, Kaizen costing is used during the manufacturing phase and involves team work by employees continually looking for ways of reducing costs and improving quality
8 Environmental management accounting
Businesses have become increasingly aware of the environmental implications of their operations. Poor environmental behaviour has an adverse impact on the business due to the possibility of fines, loss of sales etc.. As a consequence, environmental issues need to be measured and managed.
Techniques that are useful for managing environmental costs include:
input / output analysis
record material flows in order to discover what happens to the material input – what proportion of it ends up in the final product, what proportion ends up as waste, etc..
flow cost accounting
concentrates more on where material losses are occurring within the business, with the aim of reducing the quantities of materials used.
environmental activity based costing
ABC distinguishing between environment –related costs (e.g. direct waste disposal costs) and environment –driven costs (more general overheads e.g. higher staff costs)
life cycle costing
e.g. Xerox developed new packing for photocopiers that could be used both for the delivery of new machines and the return by customers of old machines – the packaging was re-usable.