
Activity Based Costing & Activity Based Management
1 Introduction
This chapter begins with a revision of activity based costing (ABC), which you met in CIMA P1. It then moves on to the applications the P2 syllabus actually asks for: activity based management (ABM), customer profitability analysis, direct product profitability and distribution channel profitability.
The syllabus outcome behind the whole chapter is P2A1 — “Apply cost management and cost transformation methodology to manage costs and improve profitability”. Read the five topics it names, because they set the order of what follows: engendering a cost-conscious culture; the logic of ABC as the foundation for managing costs; ABM to transform the efficiency of repetitive overhead activities; ABM to analyse and improve customer profitability; and ABM to analyse and improve channel performance.
The point of ABC in P2
In P1 the question was how do you calculate an ABC cost? In P2 it is what do you do with it? A more accurate cost changes nothing on its own — the total overhead is the same however it is split. The gain comes from the decisions the better cost makes possible, and from the fact that building the cost forces management to find out why the overheads are being incurred at all.
2 Revision of activity based costing
This recording works Example 2 from end to end and revises the whole of section 2. It is sound throughout, and it adds the argument section 2.4 is built on: ABC “forces us to determine what causes the overheads and that leads to greater efficiency and cost savings”.
Notice. The recording stops after ABM. Sections 3 (the cost-conscious culture and the CGMA cost transformation model) and 7 (distribution channel profitability) are not on it — the tutor says of the later pages “read it properly, I'm not going to read it to you”. They are examinable and you must read them.

Traditional absorption costing shares overheads across all products using a single volume-based cost driver, usually labour hours or machine hours.
A modern manufacturing environment needs something more discriminating. Automation has raised overheads as a proportion of total cost well above the level of earlier decades, so how those costs are attributed now matters far more than it did.
Under ABC the overhead costs become visible and the activities that cause them are understood. The cost of a product then reflects the resources that product actually consumes, which supports better pricing and better product decisions. The difference between an ABC cost per unit and an absorption cost per unit can be large — particularly where a high overhead is spread over a diverse product range.
2.1 Why the difference matters — XY Co
XY Co manufactures two office printers. One is a simple model that prints black and white text only. The other is a high-specification “smart” printer with multiple capabilities. Both take about three machine hours to produce.
XY Co's absorption costing system shares overheads on machine hours at a predetermined absorption rate, so it charges both models with much the same overhead per unit.
When management scrutinise those overheads they find a variety of causes: quality inspections, wi-fi testing, ordering costs, customer service enquiries. The smart printer needs a wider range of specialised testing, more component requisitions and far more post-sale enquiries than the simple model.
It is therefore not defensible to charge the two printers the same overhead on a crude measure of machine hours. The smart printer should carry the larger share, because it causes the larger share. ABC is how that is done.
The benefit of a more accurate cost
Explain the benefits that can be gained from a better allocation of overheads and a more accurate product cost.
Show answerHide answer
2.2 The ABC method
You may be asked to compute costs under an ABC system, so the process is set out again below.
Identify the major activities that give rise to the overhead costs (for example quality testing, ordering, machine set-ups).
Determine what causes the cost of each activity — the cost driver (number of inspections, number of orders, number of set-ups).
Collect the total cost of each activity — the cost pool.
Calculate a cost per unit of cost driver (a cost per inspection, a cost per set-up).
Charge the overhead cost to the product lines on their usage of the cost-driving activities.
Divide by the units produced to get an overhead cost per unit for each product.
Add that overhead per unit to the direct costs to give the full ABC product cost.
Step 4 asks for the cost per unit of cost driver, not the cost per unit of product. The machining overhead in Example 2 is the standard trap: the driver data says two machine hours per unit, and the cost per machine hour is the total machining overhead divided by the total machine hours worked — 94,000 of them — not by the two hours per unit.
CIMA objective test questions carry roughly two marks each, so it is unlikely that one will require a full ABC allocation with every step above. You still need to be familiar with the whole sequence before you can answer a question on any one part of it.
ABC against absorption costing
Una manufactures three products: A, B and C.
Data for the period just ended is as follows.
A | B | C | |
Production (units) | 20,000 | 25,000 | 2,000 |
Selling price (per unit) | $20 | $20 | $20 |
Material cost (per unit) | $5 | $10 | $10 |
Labour hours (per unit) | 2 hours | 1 hour | 1 hour |
Labour is paid at the rate of $5 per hour.
Overheads for the period were as follows.
Set-up costs | $90,000 |
Receiving | $30,000 |
Despatch | $15,000 |
Machining | $55,000 |
$190,000 |
Cost driver data:
A | B | C | |
Machine hours per unit | 2 | 2 | 2 |
Number of set-ups | 10 | 13 | 2 |
Number of deliveries received | 10 | 10 | 2 |
Number of orders despatched | 20 | 20 | 20 |
Required:
Calculate the cost, and hence the profit, per unit absorbing all the overheads on the basis of labour hours.
Calculate the cost, and hence the profit, per unit absorbing the overheads using an activity based costing approach.
Show answerHide answer
2.3 The ABC cost hierarchy
ABC classifies costs into four levels. The level tells you what the cost varies with, and therefore what a sensible driver would be.
Level | Varies with | Example |
Unit level | Each unit of output | Power used by the machines each time a unit is made |
Batch level | Each batch processed | Machine set-up costs, incurred every time a new batch is started |
Product sustaining | The existence of the product line, not the volume | Design costs, product-specific testing and approvals |
Facility level | Nothing traceable to production activity | Factory rent, administrative staff salaries |
Facility level costs are the ones with no defensible driver. In practice most companies use ABC for the overheads that have an identifiable driver and absorb the remainder on a traditional rate — see section 2.4.
2.4 Strengths and weaknesses of ABC
Strengths | Weaknesses |
A more accurate cost per unit, and therefore a more defensible selling price. | Not every overhead has an identifiable cost driver. Factory rent is the standard example: there is no activity that causes it. |
Better decisions where the price is set by the market and cannot be changed — Example 2 reverses which product is the problem. | It is time-consuming, and therefore expensive, to identify the activities, the pools and the drivers, and to keep them current. |
It forces management to ask why an overhead is incurred at all. Once you know set-ups cost $3,600 each, the question becomes whether C could be made in larger batches. | On its own it changes nothing. Total overhead is $190,000 however it is split; the benefit comes only from the decisions that follow. |
It gives a defensible basis for extending the analysis to customers, products and channels — which is what sections 4 to 7 do. | In practice the result is a hybrid system, which is harder to explain to non-financial managers than a single absorption rate. |
The last strength is the one to lead with in a written answer. Traditional costing takes the $190,000 and spreads it; ABC makes management find out that $90,000 of it is set-ups, that there are 25 set-ups, and that C is being made in batches of 1,000 while A is made in batches of 2,000. Fewer set-ups would need fewer set-up staff, and the $90,000 itself would fall. Accuracy is the means; cost reduction is the end.
3 Engendering a cost-conscious culture
The first topic the syllabus names under P2A1 is engendering a cost-conscious culture. It comes first for a reason: none of the techniques in this chapter reduces a single dollar of cost by itself. They produce information. Costs fall only when people throughout the organisation act on it.
A cost-conscious culture is one in which cost is everyone's concern rather than the finance function's, in which cost information is shared rather than reported upwards, and in which reducing the driver of a cost counts for more than trimming the cost itself. It is built through leadership, training, and reward systems that recognise cost improvement — and it is undermined by targets that reward volume alone.
3.1 The CGMA cost transformation model
The CGMA cost transformation model sets out six changes designed to help a business achieve and then retain cost competitiveness.
The six changes | What it means in practice |
1 Creating a cost-conscious culture | Strive for cost leadership — costs below those of competitors, tested against benchmarks. Commitment to cost reduction runs through every level and every employee, and technology is used to control costs. |
2 Understanding cost drivers | Investigate what causes costs and how different variables move them. Plans should aim at reducing the drivers, not only the costs. ABC is the tool used here. |
3 Managing the risks that come from a cost-conscious culture | Cost reduction carries risks to quality and customer satisfaction. The risk management process must identify those risks and mitigate them, or the saving is bought at a higher price than it looks. |
4 Connecting products with profitability | Ensure products and services are individually profitable and make a positive contribution. Accurate individual product costs and a defensible allocation of shared costs are what make this possible. |
5 Maximising value from new products | Assess the profitability of a new product before production begins, and design it to be adaptable so that it can be varied to satisfy as many customer segments as possible. |
6 Incorporating sustainability | Consider the environmental impact of products. Negative impacts such as unnecessary waste add cost as well as damaging reputation and sales. |
Elements 2 and 4 are this chapter. Element 5 is chapter 3 (target costing) and chapter 4 (life-cycle costing); element 3 is chapter 17 (risk management). If a question asks how management accounting supports cost transformation, the model is the frame and the rest of section A is the content.
3.2 Using ABC well — and badly
Actions to take | Actions to avoid |
Get buy-in from the rest of the business. ABC gives business managers, as well as the finance function, the information needed to make value-based decisions. Use ABC for pricing and product prioritisation decisions. Have management accountants implement it — they are best placed to manage the process and to ensure the benefits are realised. | Do not get caught up in too much detail and control. It obscures the bigger picture, and a quest for small savings can lose sight of the strategic objectives. Do not fall into the trap of thinking ABC costs are relevant for all decisions. Not all costs disappear if a product is discontinued — building occupancy costs are the usual example. |
4 Activity based management
4.1 What ABM is
Activity based management uses the principles and the information of activity based costing to control and reduce unnecessary costs by acting on their cause. It streamlines operations and drives continuous improvement by focusing on value as the customer perceives it.
ABC lets management understand what causes costs. From there, costs can be controlled and reduced by controlling and reducing the demand for the cost-causing activities.
ABM then applies the same approach to other outputs of the business — the true cost of serving a customer segment, of running a project, of offering a service — and uses that insight to make better operational and strategic decisions: investment in new methods or machinery, redesign of product components, changes to the service levels offered.
4.2 ABM in practice
Identify the activities within every process and function of the business.
Classify each activity as value-adding or non-value-adding. A value-adding activity is one the customer would be willing to pay for; a non-value-adding activity represents inefficiency and waste, and should be reduced and ideally eliminated.
Train and empower staff at every level to support the activity based approach — they are the people who see the waste.
Improve profit by combining lean production, continuous improvement and a focus on increasing value from the customer's point of view.
4.3 ABM and repetitive overhead activities
The syllabus names one application of ABM specifically: transforming the efficiency of repetitive overhead activities. These are the high-volume, low-value transactions that sit in the overhead and are almost never examined — raising a purchase order, receiving a delivery, raising an invoice, chasing a payment, setting up a machine, handling a routine customer enquiry.
ABC gives each of them a price. Once a delivery costs $1,364 and a set-up costs $3,600, three questions become answerable.
Can the activity be eliminated? A quality-inspection activity exists because defects exist; remove the defects and the inspection cost goes with them.
Can the number of times it happens be reduced? Fewer, larger deliveries; fewer, larger batches; consolidated invoicing; self-service ordering that removes the order-processing step altogether.
Can the cost of each occurrence be reduced? Automation, standardisation of the process, or moving the transaction to a lower-cost channel.
The saving is real only if the resource released is actually removed or redeployed. If the set-ups fall from 25 to 15 but the same set-up staff remain on the payroll, the cost pool is unchanged and all that has happened is that a rate has moved. That is the discipline behind element 2 of the CGMA model, and it is the difference between a cost analysis and a cost transformation.
4.4 Continuous improvement — performance management under ABM
Successful implementation of ABM gives management an understanding of the costs of value-adding and non-value-adding activities within the organisation.
The total cost of each type can then be monitored over time, and the performance of the activities themselves measured — in speed, efficiency and quality — rather than only in money. A falling ratio of non-value-adding to total activity cost is the headline measure.
4.5 Conditions for success
It requires the commitment of the whole organisation — a culture change that has to be incentivised and actively managed through effective leadership and employee involvement.
Investment of time and money is needed to support a fully integrated ABM approach.
New systems are required for cost recording, performance measurement and reporting. This depends on IT capability and on the compatibility of the accounting systems with the rest of the business.
ABM must be aligned with the strategic objectives. It is not a short-term cost-cutting exercise: it has to increase product profitability and customer value.
5 Customer profitability analysis
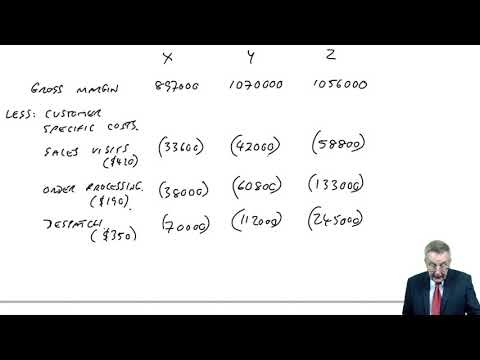
This recording works Examples 3 and 4 and explains what to do with the ranking once you have it — “some of the ways we can manage our customers differently … it does give us an idea where to direct our attention”.
Notice. It covers sections 5 and 5.3 only. Direct product profitability (section 6) and distribution channel profitability (section 7) are not on either of this chapter's recordings, and section 7 carries the syllabus topic “ABM to analyse and improve channel performance”.
Customer profitability analysis (CPA) applies activity based principles to customers or customer segments. The revenues and the service costs attributable to each customer type are analysed to establish how profitable that customer really is.
Customers are supposed to be king, but some customers are far more profitable than others — and management frequently find that certain customers cost more to serve than the margin they generate. The gross margin alone will never show this, because the costs of serving a customer sit in the overhead.
5.1 Pareto analysis
It is commonly found that a small number of customers provide the majority of a business's profit. The 80:20 rule, or Pareto's law, describes the situation where 20% of the customers are responsible for 80% of total profit. Of the remaining 80% of customers, the rule suggests half contribute a lower margin and half are actually loss-making.
Strategies can then be formulated so that service levels are focused on retaining the most profitable customers, the lower-margin groups have less time devoted to them (perhaps moving to automated or self-service channels), and genuinely loss-making customers are repriced, renegotiated or referred elsewhere.
Ranking customers
Vilnius plc manufactures components for the heavy goods vehicle industry.
The following annual information regarding three of its key customers is available.
X | Y | Z | |
Gross margin | $897,000 | $1,070,000 | $1,056,000 |
Orders placed | 200 | 320 | 700 |
Sales visits | 80 | 100 | 140 |
Invoices raised | 200 | 320 | 700 |
The company uses an activity based costing system and the analysis of customer-related costs is as follows.
Sales visits | $420 per visit |
Order processing | $190 per order placed |
Despatch costs | $350 per order placed |
Billing and collections | $97 per invoice raised |
Using customer profitability analysis, how would the customers be ranked?
Show answerHide answer
5.2 The customer profitability statement
There is no set format, but a statement would normally look like the one below.
$'000 | $'000 | |
Revenue at list prices | 100 | |
Less: discounts given | (8) | |
Net revenue | 92 | |
Less: cost of goods sold | (50) | |
Gross margin | 42 | |
Less: customer-specific costs | 28 | |
financing cost of the credit period | 3 | |
customer-specific inventory | 2 | |
(33) | ||
Net margin from customer | 9 |
Which customer is the more profitable?
Frodo plc supplies shoes to Sam plc and Gollum plc. Each pair of shoes has a list price of $50 and costs Frodo plc $25.
As Gollum buys in bulk it receives a 10% trade discount on every order of 100 pairs or more. Sam receives a 15% discount irrespective of order size, because that company collects the shoes and so saves Frodo plc any distribution cost.
The cost of administering each order is $50 and the distribution cost is $1,000 per order. Sam makes 10 orders in the year, totalling 420 pairs of shoes. Gollum places 5 orders of 100 pairs each.
Which customer is the more profitable for Frodo plc?
Show answerHide answer
5.3 Customer profitability and the customer life cycle
Before acting on a customer profitability ranking, management should also consider where the customer sits in its life cycle. Customers often start out loss-making: it costs money to win the business, and promotional offers may be necessary. From there they can develop into long-term profitable revenue streams.
Student bank accounts
A high-street bank is seeking to attract student customers, whom it recognises have very little money. It offers this customer group a free railcard, a large interest-free overdraft and a dedicated student business adviser.
What is the justification for this, and how does it fit with the customer life cycle in terms of long-term profitability?
Show answerHide answer
6 Direct product profitability
Direct product profitability (DPP) is found mainly in the retail sector.
It applies the same activity based principles, this time to arrive at a true product cost — the purchase price plus the indirect costs of distribution, warehousing and retailing that the product causes.
Comparing that true cost with the selling price gives a net profit per product rather than a gross margin. Warehousing and transport costs may be charged on the volume or the shelf area the product occupies; handling costs on the number of pallets handled.
DPP typically reverses the ranking of bulky, slow-moving, low-margin lines against small, fast-moving, high-margin ones — which is exactly the same effect, and for the same reason, as Example 3.
7 Distribution channel profitability
A distribution channel is the point of purchase for the customer — a shop, a website, a telephone order line, a mail order catalogue, a mobile app, a third-party marketplace.
Each channel offered can be analysed for its true cost, so the relative profitability of each channel can be established. Decisions on future selling methods and on product pricing can then reflect the findings. This is the syllabus topic “ABM to analyse and improve channel performance”, and it matters more each year as customers move between channels.
7.1 The impact of digital channels
Modern technology has widened the range of distribution channels. Profitability has been enhanced for many companies that have taken advantage of electronic channels — direct downloads, phone apps, social selling and marketplaces alongside traditional websites.
Not all products and services suit distribution this way, but many retailers have reached new markets and won customers through digital channels. Software developers sell directly through app stores; sellers of physical goods reach customers through online marketplaces.
A digital channel is not automatically the cheapest one. It usually replaces a high fixed cost (premises, shop staff) with a variable cost per transaction (platform commission, payment processing, picking, packing, delivery and — the item most often forgotten — returns). Channel analysis has to charge all of them.
Channel profitability — the shape of the answer
A retailer sells the same $60 item through a store and through its website. Cost of goods sold is $36 in both cases.
Per unit sold | Store | Website |
Revenue | $60.00 | $60.00 |
Cost of goods sold | (36.00) | (36.00) |
Gross margin | 24.00 | 24.00 |
Store occupancy and staff (per unit sold) | (9.50) | – |
Picking, packing and delivery | – | (6.20) |
Payment processing and platform commission | (0.60) | (2.40) |
Returns handling (2% of store sales, 18% of web sales) | (0.30) | (2.70) |
Net channel margin | 13.60 | 12.70 |
The gross margin is identical and tells you nothing. The channels separate on the customer-related activities, and the single largest difference is the return rate — an activity the store barely incurs. The action the analysis points to is not “close the website” but “attack the return rate”: better sizing information, better images, and a charge or a restriction on serial returners.
ABC gives a more accurate cost by charging each overhead on the activity that causes it. ABM is what you do with that cost: classify activities as value-adding or non-value-adding, attack the repetitive overhead activities by eliminating them, reducing how often they occur or reducing the cost of each occurrence, and extend the same analysis to customers, products and channels. In every one of those analyses the gross margin ranks them one way and the customer-, product- or channel-specific costs rank them another — and it is the second ranking that should drive the decision. None of it reduces a cost until somebody acts, which is why the syllabus puts a cost-conscious culture first.
8 Test your knowledge
Two quick checks before you move on: work through the flashcards to fix this chapter’s key terms and definitions, then sit the objective questions for exam-style practice. Both mark themselves and explain the answers as you go.
Activity Based Costing & Activity Based Management
12 questionsAnswer the questions one at a time. Your progress is saved so you can leave and come back.
Open chapter practice