
Financial and Non-Financial Objectives

1 Introduction
An organisation's financial strategy is the set of decisions it takes about where to invest, how to finance those investments and what to return to the providers of its finance. Those decisions can only be judged against something, and that something is the organisation's objectives. This chapter is about setting them and measuring them.
Objectives are not the same in every organisation. A listed company, a family company, a charity and a state hospital are all trying to do different things with the money they control, so the first job is to identify what kind of organisation is being looked at (section 1). The second is to separate the two families of objective that every organisation has: financial objectives, expressed in money (section 2), and non-financial objectives, which are not (section 3). The rest of the chapter is the measurement machinery — the ratios, growth rates and forecasts by which a financial manager decides whether an objective has been met (section 4).
Objectives cannot be set for the shareholders alone. Many groups have a stake in what an organisation does, and their interests conflict as often as they coincide:
Stakeholder | What they want from the organisation |
Shareholders | A return on their investment — capital growth in the share price and a dividend — commensurate with the risk they are carrying |
Lenders and other finance providers | Interest paid when due, the principal repaid, and enough headroom in the numbers that the loan stays safe |
Employees | Job security, fair pay, development and opportunity; safe working conditions |
Managers and directors | The same as employees, plus rewards linked to the performance they are held to |
Customers | Quality, price, service and continued innovation in the product |
Suppliers | Continuing orders and payment on the agreed terms |
Government and regulators | Taxes paid, jobs created, laws and industry rules complied with, and growth achieved responsibly |
The community and the environment | Local employment and local spending; no more environmental damage than the community will accept |
Setting objectives therefore means balancing these interests rather than optimising any one of them — a process usually called satisficing: doing enough for each group to keep its support, while pursuing the primary objective of the organisation.
Work this for yourself.
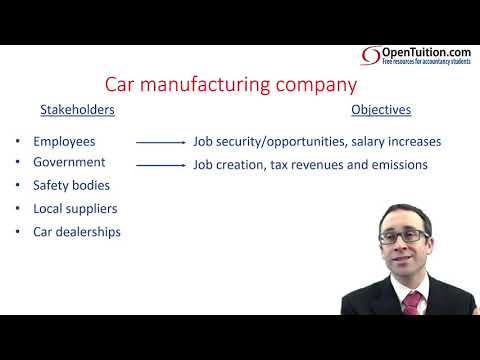
Take an organisation you know — a car manufacturer, an airline, a supermarket, a hospital — and be specific about its stakeholders rather than copying the list above. Not "customers" but the dealerships that sell its cars; not "suppliers" but the component makers whose whole order book it is. Then write down what each of them wants. The exercise is worth more than the list, because the exam tests whether a stated objective actually serves the stakeholder it claims to serve.
Four recordings open this chapter. They were made under the previous syllabus and are sound on what they cover, but carry four things with you.
Introduction to Financial Strategy: it sends you to “chapter three” for the Global Reporting Initiative and integrated reporting. That is Chapter 2 in these notes.
Objectives of entities: it sets value for money aside as “more of a non-financial objective”. The 2027 syllabus lists it under F3A1b, financial objectives, and this chapter follows the syllabus. It also calls the non-financial capitals “factors”; they are capitals — stores of value — and Section 3 explains why the word does work.
Dated framing: the stakeholder and objectives illustrations are nationalised and dated. Nothing in them is wrong; the examples have simply aged.
Notes-only: the capitals as stores of value, what makes a non-financial objective usable, and the United Nations Sustainable Development Goals are taught only in these notes. No recording reaches them.



2 Types of organisation and their objectives
The objective of an organisation follows from who owns it and why it exists. Four splits matter, and an organisation sits somewhere on each of them.
2.1 For-profit and not-for-profit
A for-profit organisation trades in order to make a profit for its owners. A not-for-profit organisation exists to deliver a service or pursue a cause; the excess of its revenues over its costs is called a surplus, not a profit, and it is not distributed to owners — it is reinvested in the mission.
This does not mean a not-for-profit organisation is indifferent to money. A charity that generates a larger surplus can fund more of its cause, so a surplus target is a perfectly sensible objective for it. What distinguishes it is that the surplus is a means and the mission is the end, whereas in a for-profit organisation the return to the owners is the end.
2.2 Incorporated and unincorporated
An incorporated entity — a company — is a legal person separate from its owners; it owns its own assets, owes its own debts, and the liability of its shareholders is limited to what they have agreed to subscribe. An unincorporated business — a sole trader or a partnership — is not legally separate from the people who run it, so the owners are the business.
Both are normally trying to make a profit for their owners. The difference matters to financial strategy because incorporation is what makes it possible to raise equity from people who take no part in running the business, and that in turn creates the separation of ownership from control that the rest of this paper is about.
2.3 Quoted and unquoted
A quoted (listed) company has its shares traded on a stock exchange; an unquoted company does not. Three consequences follow, and all three affect the objectives that can sensibly be set:
a quoted company has an observable share price, so shareholder wealth can be measured directly and continuously — an unquoted company's shares have to be valued (Chapters 13 and 14);
a quoted company is publicly accountable: it publishes results, it is followed by analysts and its objectives are stated in public and judged in public, so missing a stated target has an immediate market consequence;
a quoted company has access to a public market for new equity and new debt, so it has financing options an unquoted company does not.
An unquoted company therefore has more latitude in the objectives it sets and how it reports against them; a quoted company has less, and should set targets it expects to hit.
2.4 Private sector and public sector
A private sector organisation is owned by private individuals or institutions. A public sector organisation is owned by the state and funded, directly or indirectly, by taxation. Its objective is to deliver a service to the public, and because it does not sell that service at a market price, its financial objective is normally expressed as value for money rather than as profit.
Value for money is conventionally broken into three tests, and a good public-sector objective names which one it is about:
The three Es | The question it asks | An objective that tests it |
Economy | Are the inputs obtained at the lowest reasonable cost? | Reduce the average cost per unit of a purchased input by 3% |
Efficiency | How much output is obtained per unit of input? | Increase cases handled per member of staff by 5% |
Effectiveness | Is the intended outcome actually achieved? | Raise the proportion of patients treated within the target time to 90% |
Putting the four splits together:
Type of organisation | Who has the residual claim | Primary objective | How achievement is measured |
Quoted company | Shareholders, in a traded share | Maximise shareholder wealth | Share price growth plus dividends; investor ratios |
Unquoted company | Shareholders, in an untraded share | Maximise shareholder wealth | Earnings and dividend growth; a periodic valuation |
Sole trader or partnership | The proprietors themselves | Maximise the proprietors' income and capital | Profit, drawings, and the value of the business |
Not-for-profit organisation | Nobody — the surplus is retained for the cause | Deliver the mission | Outputs and outcomes achieved; surplus available to reinvest |
Public sector body | The state, on behalf of the public | Deliver the service, and value for money | Economy, efficiency and effectiveness measures |
Financial objectives
A steady increase in earnings is LEAST likely to be a financial objective of which one of the following types of entity?
A public listed company
A 'not-for-profit' entity
A private limited company
An unincorporated entity
Show answerHide answer
Profit and not-for-profit organisations
The primary objectives of for-profit and not-for-profit entities are:
For-profit | Not-for-profit | |
(a) | Maximisation of wealth | Minimise costs |
(b) | Output of goods/services | Minimise costs |
(c) | Maximisation of wealth | Provision of goods/services |
(d) | Output of goods/services | Provision of goods/services |
Show answerHide answer
3 Financial objectives
A financial objective is one expressed in money, or in a ratio of money amounts. The syllabus names four families of them.
3.1 Maximising shareholder wealth
For a company owned by shareholders, this is the primary financial objective. Shareholder wealth has two components — the market value of the shares held, and the dividends received — so a financial manager should choose the strategy expected to produce the largest combination of the two.
In a quoted company the first component is observable: shareholder wealth is measured by the market value of the shares. That is why so much of this paper asks what a decision will do to the share price. The combined measure, growth in the share price plus the dividend received, is the total shareholder return (section 4.2).
Wealth, not profit
Maximising shareholder wealth is not the same objective as maximising profit. Profit is one period's accounting measure; wealth is the market's view of all future cash flows, discounted, and it responds to risk as well as to return. A project that raises this year's profit but raises the risk of the business by more will reduce shareholder wealth.
3.2 Earnings growth and dividend growth
Because wealth itself is hard to target directly, companies normally set objectives on the drivers of it. The two most common are a target rate of growth in earnings per share and a target rate of growth in dividend per share, each usually expressed as a compound rate over several years rather than a single year's movement (section 4.1).
The two are linked and can conflict. A dividend growing faster than earnings means a rising payout ratio, a falling dividend cover and less cash retained for investment — which is sustainable for a while and not indefinitely. Chapter 7 takes the dividend decision on its own.
3.3 Value for money and providing a surplus
Organisations with no shareholders need financial objectives too. A not-for-profit organisation normally targets a surplus — revenue less costs — because the surplus is what funds the mission. A public sector body targets value for money, broken down into the economy, efficiency and effectiveness measures set out in section 1.4.
3.4 Whose wealth? Two models of the corporation
Where the primary financial objective is placed depends on the ownership model a country's corporate governance is built on, and the two models are worth knowing because an exam scenario may sit in either.
Model | Primary financial objective | Typical features |
Shareholder-oriented (the Anglo-American model, e.g. the United Kingdom and the United States) | Maximise shareholder wealth, while satisficing other stakeholders | Dispersed share ownership; an active market for corporate control; strong emphasis on the share price and on investor ratios |
Stakeholder-oriented (found in much of continental Europe and in Japan) | Maximise corporate wealth — the long-run value of the whole enterprise | Concentrated or bank-linked ownership; employee representation; explicit weight on technical, human and market resources as well as on financial return |
The distinction is about whose wealth is maximised, not about whether wealth matters. Both models expect the business to create value; they disagree about who has first claim on it and over what horizon it should be judged.
4 Non-financial objectives
A non-financial objective is one that is not expressed in money. That does not make it soft, and it does not make it secondary: non-financial objectives are set because the things they govern are what produce the financial results in later periods. A company that retains its key people, protects the resource base it draws on and keeps the goodwill of the communities it operates in will, other things being equal, earn more in five years than one that does not.
4.1 The non-financial capitals
The syllabus frames non-financial objectives around the idea of capitals — stores of value the organisation uses and affects, which its activities increase, decrease or transform. Three are named expressly: human capital, intellectual capital and social and relational capital. A fourth, natural capital, is treated in the same way by the reporting frameworks in Chapter 2 and is included here because most organisations have material objectives about it.
The point of the framing is that these are things to be enhanced — invested in and measured — rather than side effects to be managed. The financial objective tells you what the organisation must earn; the capitals tell you what it must not consume in earning it.
Capital | What it is | An objective that enhances it | How it is measured |
Human | The workforce: its skills, motivation, health and retention | Reduce voluntary staff turnover among key technical staff to below 8% | Turnover and retention rates, training hours, absence and safety statistics, engagement scores |
Intellectual | Knowledge-based intangibles: ideas, systems, processes, brands, patents | File a stated number of patent applications a year; complete a systems replacement | Patents and licences held, new products as a share of revenue, research spend |
Social and relational | Relationships with customers, suppliers, communities and regulators | Raise community investment by 10%; pay all small suppliers within agreed terms | Customer retention and satisfaction, supplier payment days, community spend, complaints |
Natural | The environmental resources used and the impacts caused | Reduce the carbon footprint by 25% over five years | Emissions, energy, water and waste per unit of output; renewable share |
Note what the fourth column does. A non-financial objective without a measure is an aspiration; the measure is what makes it an objective. Note also the direction of the link: an airline that invests in more fuel-efficient aircraft improves a natural-capital measure and reduces its fuel cost, and a technology company that keeps its best engineers improves a human-capital measure and keeps the innovation that drives its revenue. Non-financial objectives are usually complements to the financial ones, not competitors with them — although they can be competitors in the short run, and the exam will sometimes make them so.
Financial or non-financial?
The test is the unit of measurement, not the subject matter. "Increase the share price by 5%" and "grow earnings per share by 4%" are financial objectives: both are money measures reported to providers of financial capital. "Reduce staff sick days below the sector average" and "cut the carbon footprint by 25%" are non-financial: both have money consequences, but neither is stated in money.
4.2 What a usable non-financial objective looks like
The four objectives in the table above share four properties, and an objective that lacks any of them cannot be managed:
Quantified — a number, not a direction of travel. "Improve staff wellbeing" cannot be met or missed.
Directional — it is clear whether higher is better.
Dated — by when. A 25% reduction "over the next five years" is an objective; a 25% reduction one day is a wish.
Owned — somebody is accountable for it, and it is reported on the same cycle as the financial objectives.
4.3 The United Nations Sustainable Development Goals
The Sustainable Development Goals (SDGs) are 17 goals, supported by 169 targets, adopted by the member states of the United Nations in 2015 as a shared agenda to 2030. They cover, among other things, poverty and hunger, health, education, gender equality, clean water, affordable and clean energy, decent work and economic growth, industry and infrastructure, reduced inequalities, sustainable cities, responsible consumption and production, climate action, life below water and life on land, and peace and strong institutions.
The SDGs are addressed to governments, but they have become the common vocabulary in which organisations frame their own non-financial objectives, for a practical reason: they give every organisation the same list of headings, so that one company's environmental and social objectives can be compared with another's. Using them in objective-setting means three things:
selecting the goals on which the organisation actually has a material impact — a manufacturer with an energy-intensive process and a professional services firm will sensibly choose different ones, and a report claiming all seventeen is usually claiming nothing;
translating the chosen goals into the organisation's own quantified, dated objectives, which is the step that turns a goal into something a financial manager can manage;
reporting against them, so that the claim can be tested — which is what the frameworks in Chapter 2 exist to standardise.
Beware of the two failure modes the SDGs invite. The first is a target with no measure attached; the second is claiming a contribution to a goal the organisation does not affect. Both are recognisable in an exam scenario, and both are criticisms worth making of one.
5 Evaluating financial objectives
Three recordings cover the evaluation half of the chapter. Two figures in them are rounded where these notes are exact.
Ratios and growth trends: gearing is given as “0.84, or if you like 84 per cent”. The exact figure is 83.6%.
Investor ratios (1): return on capital employed is asserted to be operating profit. It is a ratio, not a profit figure — Section 4.2 gives the formula. The spoken earnings yield, 20.8%, is right. And the recording runs about fifteen seconds past its own ending into a producer aside; stop when the worked answer finishes.
Investor ratios (2): it restarts the dividend-ratios section cleanly after that artefact, which is why both recordings are here.


Setting an objective is the first half of the job; establishing whether it has been met is the second. Financial objectives are evaluated with ratios, with growth rates measured over several periods, and — where the objective is about the future — with forecast financial statements. This section works each in turn.
A note on the profit figures used below.
From 1 January 2027 IFRS 18 Presentation and Disclosure in Financial Statements changes how the statement of profit or loss is presented. Under IFRS 18, operating is the residual category. Operating profit is the total of that category and is a defined, required subtotal, so it is no longer a figure each preparer defines for itself; that is what makes an operating-margin comparison between two companies meaningful. IFRS 18 also introduces a second subtotal, profit before financing and income taxes.
The label profit before interest and tax (PBIT), used below and in most textbooks as the numerator of return on capital employed and interest cover, is a ratio-analysis convention. It is a perfectly good definition of a ratio numerator and it is kept here — but it is not interchangeable with the IFRS 18 subtotal, and it should never be described as though it were. F2 Chapter 21 works the distinction in full.
5.1 Ratios and growth trends
Financial objectives are commonly evaluated using ratios — margins, gearing, interest cover — and using growth trends, most often growth in earnings per share and growth in dividend per share. Growth is measured as a compound average growth rate: the constant annual rate which, applied over the period, turns the opening figure into the closing one.
Compound average growth rate = n√(Xn ÷ X0) − 1
where X0 is the figure at the start, Xn the figure at the end, and n the number of periods of growth — which is one less than the number of figures. Four annual figures from 20X3 to 20X6 contain three years of growth, so n = 3.
Compound growth in earnings per share is not the same as compound growth in earnings. If the company has issued shares during the period the two answers differ, sometimes dramatically, and the requirement always says which one it wants. Example 3 is built on exactly that difference.
Ratio calculation (1)
The following information has been extracted from Froome's financial statements for the previous four years:
Year ended | 20X3 | 20X4 | 20X5 | 20X6 |
Earnings ($ million) | 10.4 | 12.5 | 15.8 | 17.2 |
Number of shares in issue at the end of the year (million) | 100 | 100 | 150 | 150 |
Calculate the compound average growth rate in earnings per share achieved between 20X3 and 20X6, to one decimal place.
Show answerHide answer
The second common ratio objective is gearing. Gearing has no single definition, so an exam question must tell you which one it wants — debt over equity, or debt over debt plus equity — and whether to use book values or market values. Where both debt and equity are traded, market values are the better measure of what the finance is actually worth:
Gearing (debt/equity, market values) = Market value of debt ÷ Market value of equity
Gearing
Cavendish is financed by a mixture of debt and equity, both of which are traded on public markets. It has 1 million equity shares in issue, which are currently trading at $1.74 per share, and $1.5 million of redeemable bonds that are trading at 97%.
Calculate Cavendish's gearing, as debt/equity, using market values.
Show answerHide answer
5.2 Investor ratios
A company whose objective is to maximise shareholder wealth is judged by its shareholders, so the financial manager watches the ratios those shareholders watch. The formulae below are the ones this paper uses; each is worked in an example.
Returns on capital.
ROCE | Profit before interest and tax ÷ Capital employed × 100% |
ROE | Profit for the year ÷ Shareholders' equity × 100% |
Capital employed is equity plus interest-bearing debt: it is the whole of the long-term finance the business has at its disposal. So return on capital employed measures the return earned for all the providers of finance, and its numerator is therefore taken before interest is paid to any of them. Return on equity measures the return earned for the shareholders alone, so its numerator is profit for the year — after interest and after tax — and its denominator is equity alone. Reading the requirement carelessly and mixing the two is the commonest error on this topic.
Return on equity
Thomas has generated profits before interest and tax of $19.5 million and a profit for the year of $12.5 million. The company has $18 million of debt finance in the statement of financial position and its share capital and reserves are stated at $138 million.
Calculate the return on capital employed and the return on equity.
Show answerHide answer
Total shareholder return. A shareholder's return in a year is the growth in the share price plus the dividend received, expressed as a percentage of the price at the start of the year. It is also called the annual return to investors.
Total shareholder return = [(P1 − P0) + D1] ÷ P0 × 100%
Annual return to investors
Trott's shareholders require an annual return of 15% per annum. In the most recent financial statements of Trott, a dividend of $0.15 per share was recorded.
Trott's share price stood at $2.35 at the start of the year and had grown to $2.54 at the year-end.
Calculate the annual return and determine whether this will satisfy the requirement of the shareholders.
Show answerHide answer
Price/earnings ratio and earnings yield. The price/earnings ratio is the price the market is paying for each $1 of current earnings. The earnings yield is its reciprocal.
P/E ratio | Market price per share ÷ Earnings per share |
Earnings yield | Earnings per share ÷ Market price per share × 100% |
A high P/E ratio means investors are paying a lot for the earnings the company has already made, which they will only do if they expect those earnings to grow. So, comparing two companies in the same industry, the higher P/E is the market's judgement of the better prospects — and, necessarily, the lower earnings yield.
Earnings yield
Kenny has a share price of $2.50 and an EPS of 52 cents per share. Its main competitor has a P/E ratio of 6.
Calculate Kenny's P/E ratio and earnings yield, and use these to establish which company the markets consider as having the better future performance.
Show answerHide answer
Dividend ratios. Three ratios describe the dividend, and two of them are reciprocals of each other.
Dividend yield | Dividend per share ÷ Market price per share × 100% |
Dividend cover | Earnings per share ÷ Dividend per share |
Dividend payout ratio | Dividend per share ÷ Earnings per share × 100% |
Dividend yield is the cash return the shareholder gets, as a percentage of what the share costs. Dividend cover is how many times over the earnings would have covered the dividend paid — a measure of how safe the dividend is, exactly as interest cover measures how safe the interest is. The payout ratio is the proportion of earnings distributed; it is 1 divided by the dividend cover.
Dividend ratios
An extract from Hoy's statement of profit or loss is as follows:
$ million | |
Revenue | 134.2 |
Operating costs | (67.6) |
Operating profit | 66.6 |
Interest | (8.2) |
Profit before tax | 58.4 |
Tax (25%) | (14.6) |
Earnings | 43.8 |
Additional information contained in the notes to the accounts reveals the following:
the market value of each equity share was $1.84 at the year-end, and there were 100 million in issue;
a dividend per share of $0.15 was paid during the year.
Calculate the following ratios:
Dividend yield
Dividend cover
Dividend pay out
Price earnings
Show answerHide answer
5.3 Economic conditions and business variables
Financial objectives are set in an economy the financial manager does not control. Three economic variables move the numbers directly, and a strategy has to be tested against movements in each of them.
Economic variable | How it reaches the financial statements | What it does to the objectives |
Interest rates | Directly, through the finance cost on floating-rate borrowing; indirectly, through customers' disposable income and through the discount rate applied to future cash flows | Changes interest cover and covenant headroom; changes the net present value of investment projects and hence the investment decision |
Exchange rates | Through the domestic-currency value of foreign-currency revenues, costs, assets and liabilities | Moves margins in either direction depending on whether the business is a net importer or a net exporter; makes reported results of overseas operations volatile |
Inflation | Through selling prices and through input costs, rarely at the same rate; and through wage demands | Erodes customers' purchasing power and so volume; squeezes or widens the operating margin depending on which side moves faster; makes a growth target in money terms easier to hit and a real one harder |
These economic variables act on the business variables that the objectives are actually written about — sales volume, selling price, the operating margin, the finance cost, the tax charge — and it is the combination that matters. The way to answer a question on this is not to describe the economy but to rebuild the statement of profit or loss line by line with the forecast changes in it, and then recompute the ratio the objective is expressed in.
Economic variables
Wiggins's statement of profit or loss for the most recent financial year has been prepared as follows:
$ million | |
Revenue | 134.2 |
Operating costs | (67.6) |
Operating profit | 66.6 |
Interest | (8.2) |
Profit before tax | 58.4 |
Tax (25%) | (14.6) |
Earnings | 43.8 |
The company is concerned about the predicted changes in the economy. It is forecast that sales will fall by 15% due to increased competition from overseas but that operating costs will rise by only 5%.
Interest rates are predicted to fall to 5% on the $100 million variable rate loan and the tax rate will fall to 22%.
Calculate the expected earnings for next year, and the percentage change in earnings.
Show answerHide answer
6 Test your knowledge
Two quick checks before you move on: work through the flashcards to fix this chapter’s terms and definitions, then sit the objective questions for exam-style practice. Both mark themselves and explain the answers as you go.
Financial and Non-Financial Objectives
22 questionsAnswer the questions one at a time. Your progress is saved so you can leave and come back.
Open chapter practice