
Accounting ratios

A set of financial statements is a large quantity of data. Analysis turns it into an answer to a question somebody actually has: is this business doing better than last year, can it pay its debts, is it worth investing in, would it be a safe employer. This chapter is about the ratios that support those answers, about interpreting a movement rather than merely computing one, and about what the technique cannot do.
Introduction to analysis of financial performance and position: the claim that this material “makes up 25% of the syllabus” is unsourced — the 2027 syllabus prints no section weightings for F2.
This recording predates IFRS 18 Presentation and Disclosure in Financial Statements, which replaces IAS 1 for accounting periods beginning on or after 1 January 2027. Where the recording’s statement of profit or loss differs from this chapter’s, the chapter governs. Section 8.3 of this chapter sets out what changes for these ratios.

1 What analysis is for, and who is asking
Analysis of financial performance and position has two halves, and they are examined differently.
Ratio analysis — computing the numbers. This is the literal half: a figure from one statement over a figure from another, to a stated convention.
Analytical review — explaining a movement. Why has this balance or this ratio moved since last year, or why does it differ from a competitor's or from the industry average? This is the harder half, and it is where most of the marks are.
A movement has no meaning until you know who is asking and what they need from it. The same fall in the current ratio is a small matter to a shareholder and a serious one to a supplier who has not yet been paid.
User | What they are looking for | Ratios they reach for first |
|---|---|---|
Shareholders | Return, weighed against risk — a higher risk should carry a higher return. | Profitability and the investor ratios, read against gearing |
Suppliers | Will we be paid, and soon? | Liquidity and the payables payment period |
Banks and other lenders | Will the business still be here to repay the loan, and can it service the interest meanwhile? | Solvency and gearing, interest cover, liquidity |
Competitors | How does our performance compare with theirs? Absolute profit is not comparable between businesses of different size — margins are. | The margins, and return on capital employed |
Government | Whether profits are reported correctly and taxed — and non-financial matters too, such as employment created. | Profitability, plus information outside the ratios |
Customers | Whether the business will still be here to supply and support what they have bought. | Liquidity and solvency |
The syllabus asks the analysis to provide insight on four things, and it is worth fixing them at the start because two of the four are routinely neglected:
Dimension | The question | Where the evidence comes from |
|---|---|---|
Performance | How profitably has the business traded? | The statement of profit or loss — margins, return on capital employed, asset turnover |
Position | What does it own and owe, and can it meet its obligations? | The statement of financial position — liquidity, working capital, gearing |
Adaptability | How well could it absorb a shock or change direction? | Headroom: cash and undrawn facilities, gearing capacity, the fixed/variable cost mix, how specialised its assets are (§6) |
Prospects | What is likely to happen next? | Forward-looking evidence: the price/earnings ratio, capital and research spending, the trend rather than the level, and the narrative disclosures (§6) |
2 Reporting ratios along the four analytics dimensions
The 2027 syllabus asks for ratios to be reported along the dimensions of the Gartner Data Analytics maturity model — descriptive, diagnostic, predictive and prescriptive — and describes what that gives you as hindsight, insight and foresight into performance, position, resilience and prospects. It is the organising idea for this whole chapter, so learn it before the formulae rather than after them.
Dimension | The question it answers | What analysis looks like at this level |
|---|---|---|
Descriptive | What happened? | Computing and reporting the ratio. “The gross margin fell from 27.5% to 21.9%.” This is hindsight, and on its own it earns few marks. |
Diagnostic | Why did it happen? | Explaining the movement from the facts of the business. “The fall follows the launch of the new product, which appears to have been priced to win volume.” This is insight, and it is where the analytical review lives (§4). |
Predictive | What is likely to happen next? | Projecting the consequence. “Receivables days have risen from 72 to 101 while payables days rose only from 73 to 90, so the cash gap will widen again next period unless collection improves.” This is foresight. |
Prescriptive | What should we do about it? | Recommending an action, and saying what it will cost elsewhere. “Put additional resource into credit control and agree an overdraft facility now, before the peak.” This is the level F2E2 examines (§7). |
A common way to lose marks is to stop at descriptive. A list of correctly computed ratios with a sentence each saying which way they moved is hindsight, and hindsight is the cheapest of the four. Every ratio you compute should be followed by why, and — where the requirement asks for a recommendation — by so what.
3 The ratios
Ratios are standard in how they are calculated but not in what they should be: the figure a healthy manufacturer produces is not the figure a healthy construction company produces (§6). Use the same definition on both sides of every comparison, and state the definition you used.
Capital employed is defined three different ways in circulation — equity plus interest-bearing debt; equity plus non-current liabilities; and total assets less current liabilities. They give different answers, and mixing two of them inside one analysis is a real error rather than a presentational one. This chapter uses capital employed = equity + interest-bearing debt throughout, and interest-bearing debt includes short-term borrowings and overdrafts, because they bear interest. Whichever you use, use it in every ratio and in both years.
Analysis and interpretation – performance: where the recording treats profit before interest and tax and operating profit as “exactly the same” and uses operating profit for return on capital employed, from 2027 return on capital employed takes profit before financing and income taxes: operating profit plus the whole investing category, including the share of profit of associates (section 3.1). The two coincide only for a company with no investing income (section 8.3). Capital employed in these notes is equity plus interest-bearing debt, with no deduction for cash; use one definition throughout.

3.1 Performance
Margins measure the profit generated per $1 of revenue, which is what makes a large business comparable with a small one.
Gross profit margin = Gross profit ÷ Revenue × 100%
Operating profit margin = Operating profit ÷ Revenue × 100%
Net profit margin = Profit for the year ÷ Revenue × 100%
Read the first two together. A rise in the gross margin should normally bring a rise in the operating margin with it; if it does not, the business is not controlling the costs that sit between them — distribution and administrative expenses. The net margin is the least useful of the three, because the difference between operating profit and profit for the year is finance costs and tax, neither of which is within day-to-day management control. Know how to compute it; do not build an argument on it.
Two ratios then measure the return on the money tied up in the business rather than on the sales it made.
Return on capital employed = Profit before financing and income taxes ÷ Capital employed × 100%
Asset turnover = Revenue ÷ Capital employed
Return on capital employed is the headline performance indicator: it asks whether the profit earned is good relative to the capital used to earn it, which is the only way to compare a large company with a small one, or this year with a year in which the asset base was different. Asset turnover, measured in times rather than as a percentage, asks the same question about revenue: how much revenue does each $1 of capital employed generate? Higher is better for both.

3.2 Position: liquidity, working capital and solvency
Before any ratio, look at the cash. Liquidity is the ability to pay debts as they fall due, and the balance that shows it is the bank balance. A business that had cash last year and an overdraft this year has a liquidity problem, whatever its current ratio does; an analysis that discusses the current and quick ratios without mentioning that is missing the point.
Current ratio = Current assets ÷ Current liabilities
Quick ratio (acid test) = (Current assets − Inventory) ÷ Current liabilities
The quick ratio is the better indicator of short-term liquidity because it removes the least liquid current asset. Both are quoted as X:1.
The working capital ratios convert a statement of financial position balance into a number of days, using a figure from the statement of profit or loss:
Inventory holding period = Inventory ÷ Cost of sales × 365 days
Receivables collection period = Trade receivables ÷ Revenue × 365 days
Payables payment period = Trade payables ÷ Cost of sales × 365 days
Strictly, receivables days uses credit sales and payables days uses credit purchases. Neither is usually given, so total revenue and cost of sales are used instead — say which you have used.
The 365 is not a constant, it is the length of the period the profit or loss figure covers. If the statement of profit or loss data is for six months, multiply by 182.5, not 365; for a quarter, by 91.25. Using 365 against six months of cost of sales doubles every working capital period and turns a healthy business into a failing one. This is the single most reliable trap in the topic, and Example 1 below is built on it.
Solvency / gearing / risk: the recording does not hold one definition of debt across the segment. Use the definition this chapter states, and say which one you have used.

Two solvency ratios measure the longer-term risk in the way the business is financed.
Gearing = Debt ÷ Capital employed × 100% or Debt ÷ Equity × 100%
Interest cover = Profit before financing and income taxes ÷ Finance costs
Either gearing definition is acceptable where a question does not specify one — but they give very different numbers, so name the one you used and keep to it. Interest cover is measured in times and asks how many times over the profit available would meet the interest bill; below about 2 times, a lender starts to worry, and below 1 the business is not covering its interest out of trading at all. Where the profit before financing and income taxes is a loss, do not report a negative interest cover — say the interest is not covered.
Investor ratios: the recording names a national financial newspaper as its source of prices, which is illustration only, and its aside on IFRS 8 should not be followed.

3.3 Investor ratios
These matter to somebody who owns, or is thinking of buying, a share. A shareholder wants two things from it: an income, and a rising price.
Dividend cover = Profit for the year ÷ Dividends or Earnings per share ÷ Dividend per share
Dividend yield = Dividend per share ÷ Share price × 100%
Price/earnings ratio = Share price ÷ Earnings per share
Dividend cover measures how safe the dividend is — how many times over this year's profit would have paid it. Profit is not cash, though: a well-covered dividend can still be unaffordable if the cash is not there, and in most jurisdictions it must also be covered by distributable profits.
Dividend yield is the income return on the money invested. It ignores capital growth entirely, so a share with a half-percent yield whose price has doubled has not performed badly.
The price/earnings ratio is the number of years' current earnings an investor is willing to pay for the share. It is the one ratio in the set that is forward-looking: a high P/E means the market expects earnings to grow, which is why it belongs in the prospects discussion (§5) rather than the performance one.
Earnings per share is also an investor ratio, and it is dealt with in the earnings per share chapter because it has an accounting standard of its own.
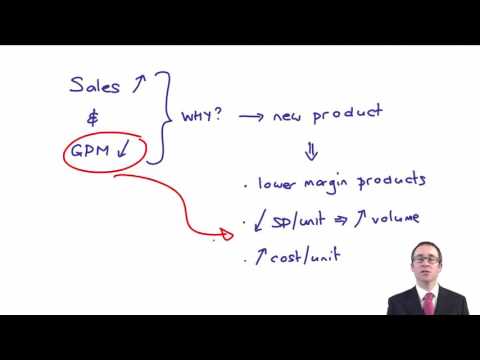
4 Interpreting a movement — the diagnostic layer
This is the part that separates a pass from a fail. A ratio has moved: the question is why, and the answer has to come from the business in front of you rather than from a memorised list. What follows is a starting stock of explanations, not a substitute for reading the scenario.
4.1 Why the gross margin moves
The gross margin can only move because the selling price per unit or the cost per unit has changed. It does not move because sales volume rose — a larger volume at the same margin gives more profit and the same percentage.
A higher gross margin | A lower gross margin |
|---|---|
A lower cost per unit: bulk purchasing and quantity discounts; a cheaper new supplier; growing purchasing power; a learning effect; automation or other efficiency gains. | A higher cost per unit: input price rises, loss of a discount, a switch to a higher-quality (dearer) input, or inefficiency in production. |
A higher selling price per unit: increased demand; a shortage of supply; a move into a higher-margin product or a bundled service. | A lower selling price per unit: discounting to win volume, a new product priced to enter the market, or price competition. |
Watch for the trade-off: a cheaper supplier protects the margin now and risks quality, reputation and warranty claims later. That is a predictive point, not a descriptive one. | Watch for the strategy: a margin cut on a product launch may be a deliberate volume play, and the test of it is whether volume actually followed. |
4.2 Why the operating margin moves differently from the gross margin
If the gross margin rises and the operating margin falls, the costs between them have grown faster than revenue. Typical causes: increased maintenance on ageing assets; higher rent or higher depreciation after a move to new premises; advertising and marketing behind a product launch; an impairment charge; a restructuring provision; or a year of unusually heavy research expenditure that could not be capitalised.
4.3 Why the working capital periods move
Ratio | A rise usually means | A fall usually means |
|---|---|---|
Inventory days | Slower-moving or obsolete inventory, with an obsolescence risk in fashion and technology; higher holding costs; a bulk purchase; a changed product profile; or goods bought for a product that did not sell. | Faster sales — but watch for the risk of stock-outs and lost customers if demand spikes. |
Receivables days | Weak credit control, often because volume has outgrown the department; longer terms granted to win business or to sell overseas. Carries a risk of irrecoverable debts. | Better credit control, or prompt payment discounts offered — which cost margin. |
Payables days | Usually cash flow difficulty: the business is using its suppliers as a source of short-term finance. Risks supplier goodwill and, ultimately, supply. Occasionally it is simply taking the credit terms it was always offered. | A new payment system, or prompt payment discounts taken — which improve profit. |
Read the three together. Receivables days rising faster than payables days widens the cash gap; that is the classic signature of overtrading — expanding faster than the working capital can support — and it is what Example 1 is about.
SAF
SAF has experienced a period of rapid expansion in the last 6 months following the launch of a new product on 1 July 20X2. The following information is available from the management accounts of SAF:
6 months to 31 December 20X2 | 6 months to 30 June 20X2 | |
|---|---|---|
$000 | $000 | |
Inventories at period end | 1,220 | 460 |
Receivables at period end | 1,715 | 790 |
Cash and cash equivalents at period end | – | 150 |
Trade payables at period end | 1,190 | 580 |
Short-term borrowing at period end | 250 | – |
Revenue for the period | 3,100 | 2,000 |
Cost of sales for the period | 2,420 | 1,450 |
Analyse the financial performance and working capital position of SAF, including the calculation of five relevant ratios.
Show answerHide answer
Investor ratios
Morgan Co is a listed company and has 50c equity share capital of $20m in issue.
The company paid a dividend per share of 10.5c in its most recent financial year and the share price at the reporting date was $1.20. The following additional financial information is available to investors:
Statement of profit or loss (extract) | |
20X9 $000 | |
|---|---|
Profit before tax | 28,350 |
Income tax expense | (5,670) |
Profit for the year | 22,680 |
Calculate each of the following investor ratios for Morgan Co:
earnings per share
dividend cover
dividend yield
the price/earnings ratio
Show answerHide answer
5 Adaptability and prospects
Performance and position are backward-looking by construction. The syllabus asks the analysis to speak to two further things, and there is no ratio for either — they are read out of the same statements by asking different questions.
5.1 Adaptability
Adaptability, or resilience, is the capacity to absorb a shock or change direction. What in a set of accounts speaks to it:
Financial headroom. Cash and undrawn borrowing facilities; how far current gearing sits below any covenant or below what a lender would accept; whether long-term borrowings are about to fall due for repayment or renegotiation.
The cost structure. A business whose costs are largely variable can shrink with its revenue; one with a high fixed cost base cannot, and its profit falls much faster than its sales. Operating margin trends across a downturn reveal this.
Asset flexibility. Highly specialised plant has little alternative use and little resale value; general-purpose or leased assets can be redeployed or given up.
Concentration. Dependence on a single product, customer, supplier or market is a resilience question that the ratios will not show — it appears in the narrative and in the receivables note.
Cash conversion. Whether reported profit is turning into operating cash flow. A business whose profits are rising while its cash is not has less room to manoeuvre than its margins suggest.
5.2 Prospects
Prospects is the forward-looking dimension, and the evidence for it is thinner and softer than for performance:
The trend rather than the level. Three years of a ratio says more about direction than one year's figure says about health.
The price/earnings ratio — the market's own view of future earnings growth, and the only ratio in §3 that is inherently forward-looking.
Investment. Capital expenditure against depreciation shows whether the asset base is being renewed or run down; research and development spending shows whether the product pipeline is being fed.
Committed future flows. Order books, long-term contracts, lease commitments and capital commitments disclosed in the notes.
The narrative disclosures. Outlook is a required Content Element of an integrated report, and climate resilience — supported by scenario analysis — is a required disclosure under the climate-related sustainability standard. Both are covered in the integrated reporting and sustainability reporting chapter, and both are evidence about prospects that no ratio provides.
6 Linking the analysis to the business model
A ratio has no absolute right answer; it has an answer that is right for this business model. The syllabus makes this link explicit, and it is the fastest way to avoid writing something foolish about an otherwise healthy company.
The business model is how the organisation turns inputs into outputs and outcomes — it is one of the Content Elements of an integrated report and the middle of the value creation process described in the integrated reporting and sustainability reporting chapter. Three examples of what it does to the ratios:
Business model | What it does to the numbers | So a “bad” ratio may be normal |
|---|---|---|
Manufacturing — buy raw materials, process, hold finished goods, sell on credit | Inventory in three forms and a long working capital cycle; a substantial asset base. | Inventory days that would be alarming in a food retailer are ordinary here. |
Service — sell time and expertise | Little or no cost of sales in the conventional sense, little inventory, and few tangible assets; much of the value is intellectual and human capital that the accounts cannot recognise. | Asset turnover looks extraordinary and gross margin may be meaningless. Judge it on operating margin and on staff-related measures instead. |
Construction and long contracts — build now, be paid on completion | Very long working capital cycles, heavy work in progress, and revenue recognised over time rather than on delivery. | Receivables and inventory periods measured in hundreds of days can be entirely normal; the question is whether they are lengthening. |
Retail — sell for cash, buy on credit | Almost no receivables, fast-moving inventory, and payables funding the business. | A current ratio below 1 is the industry norm and is not evidence of a liquidity problem. |
The same reasoning applies to a group: a consolidated set of statements aggregates businesses that may have quite different models, so a group ratio is an average of things that are not alike. That is a genuine limitation and it belongs in §8.
7 Recommending actions
F2E2 asks for recommendations, which is the prescriptive level of §2. A recommendation that will earn marks has three parts: what to do, why it follows from the analysis, and what it will cost somewhere else.
7.1 Linkages between different areas of performance
Nothing in a set of financial statements moves on its own. Before recommending an action, trace what else it moves:
Action | Intended effect | The consequence elsewhere |
|---|---|---|
Tighten credit control; offer prompt payment discounts | Receivables days fall; cash improves | Discounts allowed reduce the margin; tighter terms may lose price-sensitive customers |
Extend the time taken to pay suppliers | Payables days rise; cash improves | Supplier goodwill, discounts and ultimately continuity of supply are at risk; the business looks distressed |
Cut inventory | Inventory days fall; cash and holding costs improve | Stock-outs, lost sales and reputational damage if demand rises |
Cut the selling price to win volume | Revenue and market share rise | Gross margin falls; the gain is real only if volume more than compensates, and price is hard to put back up |
Revalue property to strengthen the statement of financial position | Equity rises; gearing falls | Depreciation rises, so operating profit and margins fall; capital employed rises, so return on capital employed falls twice over. Comparability with a company using the cost model is lost |
Take on further borrowing to fund growth | Growth is financed without dilution | Gearing rises and interest cover falls; if cover is already thin, lenders will refuse or price the risk in |
7.2 Predictive and prescriptive ratios
The syllabus names predictive and prescriptive ratios as a topic. No ratio is inherently one or the other — what makes a ratio predictive or prescriptive is the use it is put to:
Used predictively, a ratio is projected. Receivables days rising 72 → 101 in six months, held against the payables period, forecasts the cash gap next period. A trend in interest cover forecasts whether a covenant will be breached. A rising fixed cost proportion forecasts how far profit falls if revenue does.
Used prescriptively, a ratio sets a target and a lever. “Recover receivables to 75 days by the year end” is prescriptive; it names a measure, a level and a date, and it can be assigned to somebody. “Liquidity has deteriorated” is not.
7.3 The wider organisational ecosystem
A recommendation reaches beyond the entity that reports the ratio. Stretching payables improves the reporting entity's cash at the direct expense of its suppliers, some of whom are small and may not survive it; cutting inventory pushes the holding cost up the supply chain; a redundancy programme improves the operating margin and depletes human and social capital, with an effect on recruitment and on the communities the business operates in. The six capitals of the integrated reporting chapter are a useful checklist here: an action that improves the financial capital by consuming another capital has not created value, it has moved it.
In a recommendation question, the marks are rarely for the arithmetic. They are for saying what should be done, by when, why the analysis supports it, and what it costs — in margin, in relationships, or in risk.
Evaluation of ratios – example: this is DFG, Example 3. The recording counts the $39m short-term borrowings as debt for gearing (56.3%) but leaves them out of capital employed for return on capital employed in the same answer. Use one definition: these notes take equity plus interest-bearing debt, $361m. From 2027 return on capital employed and interest cover take profit before financing and income taxes, $22m, which includes the $7m share of the associate’s profit, so return on capital employed is 6.1% and interest cover 1.8 times, with no deduction for the investment in the associate.

DFG
A friend has approached you looking for some advice. He has been offered the position of Sales Director within an entity, DFG, which supplies the building trade. He commented that he had reviewed the information on DFG's website and there were lots of positive messages about the entity's future, including how it had secured a new supplier relationship in 2010 resulting in a significant improvement in margins.
He has been offered a lucrative remuneration package to implement a new aggressive sales strategy, but has been with his current employer for six years and wants to ensure his future would be secure. He has provided you with the finalised financial statements for DFG for the year ended 31 December 2010, with comparatives.
Consolidated statement of profit or loss and other comprehensive income for the year ended 31 December
2010 $m | 2009 $m | |
|---|---|---|
Revenue | 252 | 248 |
Cost of sales | (203) | (223) |
Gross profit | 49 | 25 |
Distribution costs | (18) | (13) |
Administrative expenses | (16) | (11) |
Operating profit | 15 | 1 |
Share of profit of associate | 7 | – |
Profit before financing and income taxes | 22 | 1 |
Finance costs | (12) | (8) |
Profit before tax | 10 | (7) |
Tax | (3) | 2 |
Profit for the year | 7 | (5) |
Other comprehensive income: | ||
Revaluation gain on property, plant and equipment | 40 | – |
Total comprehensive income | 47 | (5) |
Consolidated statement of financial position at 31 December
2010 $m | 2009 $m | |
|---|---|---|
Non-current assets | ||
Tangibles | 254 | 198 |
Investment in associate | 24 | – |
Current assets | ||
Inventory | 106 | 89 |
Receivables | 72 | 48 |
Cash/bank | – | 6 |
Total assets | 456 | 341 |
Share capital | 45 | 45 |
Retained earnings | 146 | 139 |
Revaluation reserve | 40 | – |
Non-current liabilities | 91 | 91 |
Current liabilities | 134 | 66 |
Total equity and liabilities | 456 | 341 |
Additional information
Long-term borrowings. The long-term borrowings are repayable in 2012.
Contingent liability. The notes to the financial statements include details of a contingent liability of $30 million. A major customer, a house builder, is suing DFG, claiming that it supplied faulty goods. The customer had to rectify some of its building work when investigations discovered that a building material, which had recently been supplied by DFG, was found to contain a hazardous substance. The initial assessment from the lawyer is that DFG is likely to lose the case although the amount of potential damages could not be measured with sufficient reliability at the year-end date.
Revaluation. DFG decided on a change of accounting policy in the year and now includes its land and buildings at their revalued amount. The valuation was performed by an employee of DFG who is a qualified valuer.
Current liabilities comprise:
2010 $m | 2009 $m | |
|---|---|---|
Trade and other payables | 95 | 66 |
Short-term borrowings | 39 | – |
134 | 66 |
Analyse the financial performance of DFG for the year to 31 December 2010 and its financial position at that date, AND briefly discuss DFG's suitability as a secure employer for your friend. (8 marks are available for the calculation of relevant ratios.)
Show answerHide answer

8 The limitations of the tools
Every conclusion above rests on ratios computed from one set of financial statements. The syllabus asks separately about the limitations of the data and the limitations of the technique.
8.1 Data limitations — quality and type of data
It is historic. Financial statements report what has happened. A management accountant works with budgets and forecasts; ratio analysis works with the past, and the past constrains what can be said about the future.
It is out of date before it is published. The statements are drawn up at a date and published weeks or months later; conditions move in between. The price/earnings ratio makes this visible — a share price that changes daily divided by an earnings figure computed once a year.
It lacks detail. The statements give revenue, cost of sales, distribution and administrative expenses, with no breakdown. Without knowing what is inside those captions, a movement in a margin can be described but not explained. Some breakdown may be available from a segment disclosure, where the entity gives one.
It is financial only. Customer retention, customer satisfaction, staff turnover, product quality and safety record are all highly relevant to future performance and appear nowhere in the ratios. The integrated reporting and sustainability reporting chapter is about exactly this gap.
It can be manipulated. Provisions can be set generously or thinly, accruals can be pushed between periods, and revenue can be recognised early or late. All of it is a matter of judgement and all of it moves the ratios, which raises an ethical question as much as an analytical one.
One-off items distort the comparison. A restructuring provision, an impairment, a profit or loss on disposal of a non-current asset, or the acquisition or disposal of a subsidiary during the year all appear in one period and not the other. For a like-for-like comparison, identify them and say what the ratios look like without them.
8.2 Limitations of ratio analysis — comparability
F2E3b asks about comparability specifically, and comparability fails in three directions.
Comparing… | Why it can mislead |
|---|---|
…one year with the next | An accounting policy may have changed; a subsidiary may have been acquired or sold, so the consolidated figures cover different businesses; a one-off item may sit in one year only. |
…one company with another, in segment | Two companies described as being in the same sector may have quite different business models (§6), and a group's consolidated ratios are an average across segments that are not alike — a strong division can conceal a failing one. Where a company gives a segment disclosure, the analysis is far better done on it than on the group total. |
…one company with another, internationally | Companies reporting under different frameworks measure profit on different rules, so the ratios are not computed from comparable numbers. Tax regimes differ, which moves every post-tax measure. Currency translation, inflation rates and local market conditions differ. In practice an adjustment would be needed to compare them properly; in an exam, compute the ratios from the figures given and say that the limitation exists. |
Accounting policy choice is the biggest single source of non-comparability, and revaluation is the clearest case. A company that revalues its land and buildings carries a higher capital employed and a higher depreciation charge, so it reports lower profit and a materially lower return on capital employed than an otherwise identical company using the cost model. Nothing about the two businesses differs; only the policy does. Inventory valued on a first-in-first-out basis in a period of rising prices gives a higher closing inventory, a lower cost of sales and a higher profit than an average-cost basis. And a gain on a financial asset may be taken to profit or loss by one company and to other comprehensive income by another, so one company's earnings move and the other's do not.
Convergence has removed some choices — borrowing costs on qualifying assets must now be capitalised, and development costs meeting the criteria must be capitalised rather than expensed — but the revaluation model, the inventory cost formula and the financial asset classifications remain, and each of them moves the ratios.
8.3 One comparability limitation that 2027 removes
This is a genuine change and it belongs in the answer to any 2027 question on comparability. Until IFRS 18 Presentation and Disclosure in Financial Statements applies — for accounting periods beginning on or after 1 January 2027 — “operating profit” was not defined by any accounting standard. Each company decided for itself what went above the line: some excluded restructuring costs, some excluded impairments, some presented no such subtotal at all. Comparing two companies' operating margins was therefore comparing two different measures with the same name.
From 2027 both operating profit and profit before financing and income taxes are required subtotals with the standard's own category boundaries behind them, computed the same way by everyone. One named comparability limitation is removed. Management's own measures do not disappear — they are disclosed as management-defined performance measures, in a single note, reconciled to the nearest IFRS subtotal — but they are now governed rather than free. A chapter or an answer that says “ratios are not comparable between companies” without noting what IFRS 18 has fixed is out of date on 2027.
“PBIT” is not the same thing as “profit before financing and income taxes”, and should not survive as a label. PBIT was an analyst's construct with no standard behind it, meaning “profit before interest and tax”. The IFRS 18 subtotal is operating profit plus the whole investing category — which includes investment income, income from investment property, and the share of profit of associates and joint ventures. For a company with no investing income the two coincide; for one with substantial investment income or a significant associate they do not. In Example 3, DFG's operating profit is $15m and its profit before financing and income taxes is $22m, because the $7m share of the associate's profit sits between them.
The consequences for this chapter's ratios are exact: the operating profit margin now has a defined subtotal as its numerator rather than a self-defined one; return on capital employed and interest cover take profit before financing and income taxes, the defined subtotal that occupies the position “PBIT” was reaching for. IFRS 18 is taught in the presentation material for the group financial statements, not here.
Compute the ratio, then explain the movement, then say what is likely to follow, then say what to do about it — descriptive, diagnostic, predictive, prescriptive. Performance comes off the statement of profit or loss as margins, return on capital employed and asset turnover; position comes off the statement of financial position as liquidity, working capital days and gearing, and the first thing to look at is the cash balance itself. Adaptability and prospects have no ratios: they are read out of headroom, cost structure, investment, commitments and the narrative disclosures. Every figure means something different in a different business model, and the technique is limited by data that is historic, undetailed, financial-only, manipulable and prepared under policies the preparer chose. From 2027 one of those limitations is smaller, because operating profit and profit before financing and income taxes are defined subtotals rather than whatever the preparer decided they meant.
9 Test your knowledge
Accounting ratios
22 questionsAnswer the questions one at a time. Your progress is saved so you can leave and come back.
Open chapter practice