
Big Data

1 Introduction
Big data are extremely large collections of data that may be analysed to reveal patterns and trends, especially relating to human behaviour.
There are many definitions of the term ‘big data’ but most suggest something like the following:
“Extremely large collections of data (data sets) that may be analysed to reveal patterns, trends, and associations, especially relating to human behaviour and interactions.”
In addition, many definitions also state that the data sets are so large that conventional methods of storing and processing the data will not work.
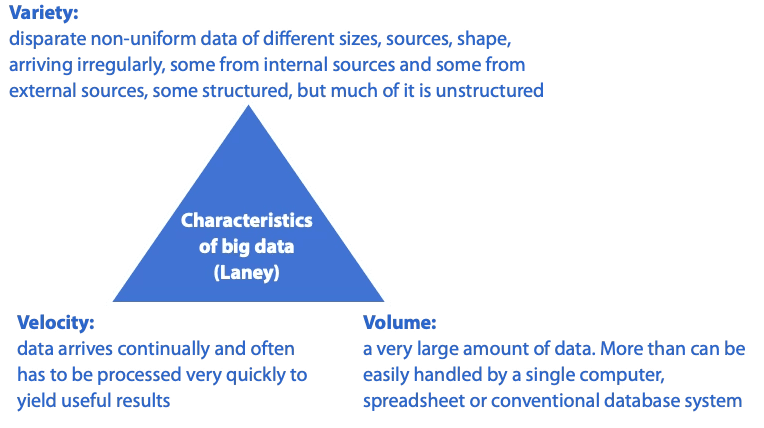
In 2001 Doug Laney, an analyst with Gartner (a large US IT consultancy company) stated that big data has the following characteristics, known as the 3Vs:
Volume
Variety
Velocity
These characteristics, and sometimes additional ones, have been generally adopted as essential qualities of big data.
The commonest fourth ‘V’ that is sometimes added is veracity: Is the data true? Can its accuracy be relied upon?
1.1 Volume
The volume of big data held by large companies such as Walmart (supermarkets), Apple and EBay is measured in multiple petabytes. What’s a petabyte? It’s 1015 bytes (characters) of information. A typical disc on a personal computer (PC) holds 109 bytes (a gigabyte), so the big data depositories of these companies hold at least the data that could typically be held on 1 million PCs, perhaps even 10 to 20 million PCs.
These numbers probably mean little even when converted into equivalent PCs. It is more instructive to list some of the types of data that large companies will typically store.
Retailers
Via loyalty cards being swiped at checkouts: details of all purchases you make, when, where, how you pay, use of coupons.
Via websites: every product you have ever looked at, every page you have visited, every product you have ever bought. (To paraphrase a Sting song “Every click you make I’ll be watching you”.)
Social media (such as Facebook and Twitter)
Friends and contacts, postings made, your location when postings are made, photographs (that can be scanned for identification), any other data you might choose to reveal to the universe.
Mobile phone companies
Numbers you ring, texts you send (which can be automatically scanned for key words), every location your phone has ever been whilst switched on (to an accuracy of a few metres), your browsing habits. Voice mails.
Internet providers and browser providers
Every site and every page you visit. Information about all downloads and all emails (again these are routinely scanned to provide insights into your interests). Search terms you enter.
Banking systems
Every receipt, payment, credit card payment information (amount, date, retailer, location), location of ATM machines used.
1.2 Variety
Some of the variety of information can be seen from the examples listed above. In particular, the following types of information are held:
Browsing activities: sites, pages visited, membership of sites, downloads, searches
Financial transactions
Interests
Buying habits
Reaction to ads on the internet or to advertising emails
Geographical information
Information about social and business contacts
Text
Numerical information
Graphical information (such as photographs)
Oral information (such as voice mails)
Technical information, such as jet engine vibration and temperature analysis
This data can be both structured and unstructured:
Structured data: this data is stored within defined fields (numerical, text, date etc) often with defined lengths, within a defined record, in a file of similar records. Structured data requires a model of the types and format of business data that will be recorded and how the data will be stored, processed and accessed. This is called a data model. Designing the model defines and limits the data that can be collected and stored, and the processing that can be performed on it.
An example of structured data is found in banking systems, which record the receipts and payments from your current account: date, amount, receipt/payment, short explanations such as payee or source of the money.
Structured data is easily accessible by well-established database structured query languages.Unstructured data: refers to information that does not have a pre-defined data-model. It comes in all shapes and sizes and this variety and irregularities make it difficult to store it in a way that will allow it to be analysed, searched or otherwise used. An often quoted statistic is that 80% of business data is unstructured, residing in word processor documents, spreadsheets, PowerPoint files, audio, video, social media interactions and map data.
1.3 Velocity
Information must be provided quickly enough to be of use in decision making. For example, in the above store scenario, there would be little use in obtaining the price-comparison information and texting customers once they had left the store. If facial recognition is going to be used by shops and hotels, it has to be more-or less instant so that guests can be welcomed by name.
You will understand that the volume and variety conspire against the third, velocity. Methods have to be found to process huge quantities of non-uniform, awkward data in real-time.
1.4 Software for big data
Without getting too technical on this issue, a library of software known as Apache Hadoop is specifically designed to allow for the distributed processing of large data sets (ie big data) across clusters of computers using simple programming models. (Clusters of computers are needed to hold the vast volume of information.) Hadoop is designed to scale up from single servers to thousands of machines, each offering local computation and storage.
The processing of big data is generally known as big data analytics and includes:
Data mining: analysing data to identify patterns and establish relationships such as associations (where several events are connected), sequences (where one event leads to another) and correlations.
Predictive analytics: a type of data mining which aims to predict future events. For example, the chance of someone being persuaded to upgrade a flight.
Text analytics: scanning text such as emails and word processing documents to extract useful information. It could simply be looking for key-words that indicate an interest in a product or place.
Voice analytics: as above with audio.
Statistical analytics: used to identify trends, correlations and changes in behaviour.
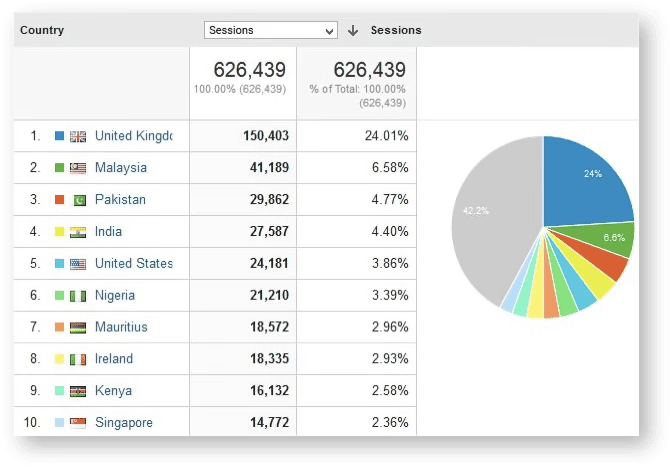
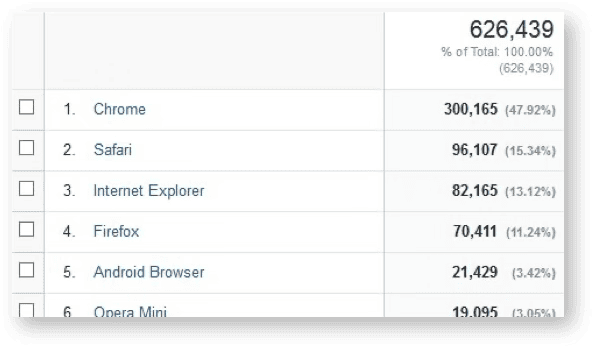
Google provides web-site owners with Google Analytics that will track many features of web-site traffic. For example, Google analytics on the OpenTuition.com reports statistics such as the following:
1.5 Geographical distribution of users:
1.6 Type of browser used
1.7 Age of user
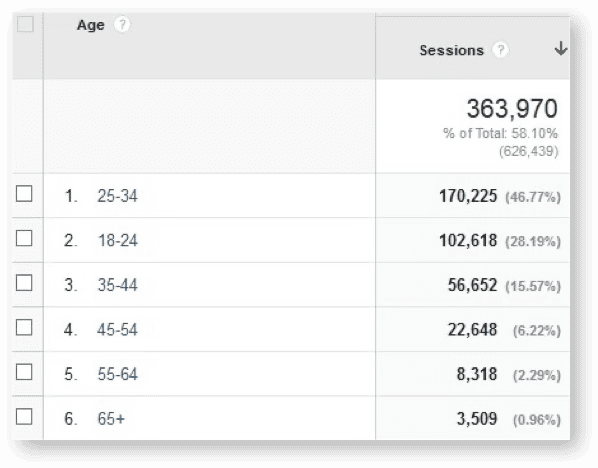
The final table is instructive. OpenTuition.com does not ask for users’ ages, so this data has been pieced together from other information available to Google; it has been able to do this for only about 58% of users.
1.8 The analytical findings can lead to:
Better marketing
Better customer service and relationship management
Increased customer loyalty
Increased competitive strength
Increased operational efficiency
The discovery of new sources of revenue.
1.9 Dangers of big data
Despite the examples of the use of big data in commerce, particularly for marketing and customer relationship management, there are some potential dangers and drawbacks.
Cost: It is expensive to establish the hardware and analytical software needed, though these costs are continually falling.
Regulation: Some countries and cultures worry about the amount of information that is being collected and have passed laws governing its collection, storage and use. Breaking a law can have serious reputational and punitive consequences.
Loss and theft of data: Apart from the consequences arising from regulatory breaches as mentioned above, companies might find themselves open to civil legal action if data were stolen and individuals suffered as a consequence.
Incorrect data (veracity): If the data held is incorrect or out of date incorrect conclusions are likely. Even if the data is correct, some correlations might be spurious leading to false positive results.
Employee monitoring: data collection methods allow employees to be monitored in detail every second of the day. Some companies place sensors in name badges so that employee movements and interactions at work can be monitored. The badges monitor to whom each employee talks and in what tone of voice. Stress levels can be measured from voice analysis also. Obviously, this information could be used to reduce stress levels and to facilitate better interactions but you will easily see how it could easily be used to put employees under severe pressure.
Objective test questions turn on the limits. Big data is not necessarily accurate or representative, so analysing it does not make a decision free of bias; and predictive analytics gives what might happen, never what will. What it does support well is decisions about customers and about new products.
Big Data and data analytics
10 questionsAnswer the questions one at a time. Your progress is saved so you can leave and come back.
Open chapter practice