
Capital structure and financial ratios

1 Introduction
The purpose of this chapter is to consider the choice between raising finance from equity or from debt and discuss the best capital structure for a company. In addition we will summarise various key financial ratios.
2 Financial Gearing
2.1 Definition
Financial gearing measures the proportion of a company’s financing that comes from debt as opposed to equity.
The attraction of debt finance is that lenders are likely to require a lower return than shareholders because an investment in debt is less risky than an investment in shares. In addition, debt interest payable by the company is normally allowable for tax which makes the net cost even lower.
However, the reason that companies do not automatically raise as much of their finance from debt as possible is that increasing the amount of debt in a company (or increasing the gearing) creates more risk for the shareholders.
The reason for the increase in risk to shareholders is that fixed interest must be paid each year before the company is able to pay dividends.
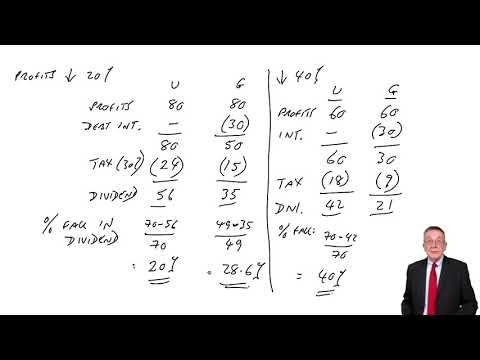
Two companies, U and G, are both generating operating profits (before interest) of $100. U is an ungeared company (with no debt finance) whereas G is a geared company and has to pay debt interest of $30 p.a..
Tax is payable at 30%, and both companies distribute all available earnings as dividend.
U | G | |
|---|---|---|
Profits | 100 | 100 |
Debt Interest | – | 30 |
100 | 70 | |
Tax @ 30% | (30) | (21) |
Available for shareholders | 70 | 49 |
Calculate the % change in dividends that will result in both companies, if profits were to fall by:
(a) 20%
(b) 40%
Measures of financial gearing
There are two standard ways of calculating the gearing ratio.
It can be defined as either:
or alternatively:
Either measure can be used (unless the examination specifies one measure). The result will differ depending on which measure is used, but in both cases the figure will increase with higher proportions of debt.
Gearing is best measured using market values for debt and for equity. If, however, market values are not available then use Statement of Financial Position values.
Lavetal plc has the following summarised Statement of Financial Position:
Non-current assets | 200,000 |
Current assets | 50,000 |
250,000 | |
Share Capital (10c shares) | 10,000 |
Reserves | 130,000 |
140,000 | |
Debentures | 100,000 |
Current liabilities | 10,000 |
250,000 |
The market values at date of the Statement are:
Shares: $2.20 per share
Debentures: 95 p.c.
Calculate the gearing ratio of Lavetal using:
(a) book values
(b) market values
3 Operating Gearing

3.1 Fixed operating costs
With financial gearing, it is the fixed interest payments that create the extra risk for shareholders.
However, companies may have fixed operating costs due to the way they have structured their operating costs between fixed costs and variable costs. More fixed operating costs increase the risk for the shareholders in exactly the same way as do fixed interest costs.
Companies A and B both have sales of $100,000 p.a. and costs of $60,000 p.a..
However company A has structured its costs such that $50,000 are variable and $10,000 are fixed, whereas B has variable costs of $20,000 and fixed costs of $40,000.
A | B | |
|---|---|---|
Sales | 100,000 | 100,000 |
Variable costs | 50,000 | 20,000 |
Fixed costs | 10,000 | 40,000 |
60,000 | 60,000 | |
Profit | 40,000 | 40,000 |
Calculate the % change in profits in both companies that results from:
(a) an increase in sales volume of 10%
(b) a reduction in sales volume of 20%
As with financial gearing, the profits of the company with the higher proportion of fixed costs is more risky than the other.
A company has flexibility as to how to structure its costs. For example, staff costs can be fixed by employing staff on annual contracts, or can be variable by employing staff on a day-to-day basis.
In times of growth it will be advantageous to have a high proportion of fixed costs and a low proportion of variable costs. However, in times of recession the opposite is true.
Take the figures the statements give you: long-term borrowing only in the debt figure, so trade payables and other current liabilities stay out, and the operating profit as reported rather than one rebuilt from the cost lines. Then answer the half that marks usually go missing on — what the ratio means for this company. Financial gearing makes dividends swing further when profit moves and operating gearing makes profit swing further when sales move, so a rise in either is a rise in the risk a lender is being asked to take.
3.2 Measures of operating gearing
There is no standard measure of operating gearing, however the suggested measure is as follows:
4 Other financial ratios

Statement of Financial Position at 31 December
2002 | 2001 | |
|---|---|---|
Non-current assets | 300,000 | 320,000 |
Current assets | 80,000 | 70,000 |
380,000 | 390,000 | |
Ordinary Share capital (10c shares) | 60,000 | 60,000 |
7% Preference shares ($1 shares) | 40,000 | 40,000 |
Reserves | 160,000 | 140,000 |
260,000 | 240,000 | |
6% Debentures | 100,000 | 100,000 |
Current liabilities | 20,000 | 50,000 |
380,000 | 390,000 |
Statement of Profit or Loss for the year ended 31 December
2002 | 2001 | |
|---|---|---|
Sales | 510,000 | 480,000 |
Profit before interest and tax | 52,000 | 49,000 |
Interest | 6,000 | 6,000 |
Profit before tax | 46,000 | 43,000 |
Tax | 12,000 | 10,000 |
Net profit after tax | 34,000 | 33,000 |
Dividends: | ||
Ordinary shares | 20,000 | 15,000 |
Preference shares | 2,800 | 2,800 |
Retained profit | 11,200 | 15,200 |
The market values at 31 December:
2002 | 2001 | |
|---|---|---|
ordinary shares | $0.83 | $0.72 |
preference shares | $0.90 | $1.01 |
6% debentures | $110 | $118 |
Calculate (for each of the two years) the following ratios:
Debt holder ratios:
Interest cover
Interest yield
Shareholder ratios:
Dividend per share
Dividend cover
Dividend yield
Earnings per share (EPS)
Price earnings ratio (P/E ratio)
Capital structure and financial ratios (gearing)
10 questionsAnswer the questions one at a time. Your progress is saved so you can leave and come back.
Open chapter practice