
Macroeconomics

1 Introduction to macroeconomics

The term ‘macroeconomics’ refers to the branch of economics that deals with national and international economics. ‘Microeconomics’, which will be dealt with later deals with the study of specific markets for products and services.
Macroeconomics therefore covers topics such as:
How can the size of a country’s economy be measured?
How could the economy be made to grow?
What are the unemployment rate and what affects this?
What causes inflation and how can that be controlled?
What determines currency exchange rates?
How to imports compare to exports?
2 Government influence on business
Governments can have a huge influence on businesses:
Policy | Affects: |
|---|---|
Overall economic policy | Demand, taxation, cost of finance (interest rates |
Industry policy | Regulation, planning, grants, tariffs/quotas, free trade |
Environmental and infrastructure policy | Planning, costs (eg carbon or pollution tax), transport costs and efficiency |
Social policy | Education, retirement, pensions, employment protection |
Foreign policy | EU compliance, World Trade Organisation, foreign trade, banned exports and imports |
3 National income
National income is a measure of the size of a country’s economy. National income can be defined as:
the total value a country’s final output of all new goods and services produced in a year
The word ‘final’ is important. If Company A sold goods to consumers, then the value of those sales would be part of national income. However, if Company A sold to Company B and Company B sold to the public for the same price, then the sales revenue would appear in both company’s accounts and there would be double-counting if both amounts were included in national income. To avoid this, only Company B’s sales would be included in national income.
The higher the national income, the more income is available for a country’s population
If an item is sold for €50, then that amount appears in two places:
The amount spent by the consumer (consumption or expenditure)
The amount received by the seller (income)
The consumption (expenditure) and income must be equal.
Of course, there is another set of flows. For example, companies employ people and pay wages whilst employees can use their wages to buy goods from companies. Recognition of these two sets of flows (wages/labour, sales of goods/purchases of goods) gives rise to the circular flow of income.
There are two main measures of national income:
Gross domestic product (GDP)
Gross national product (GNP)
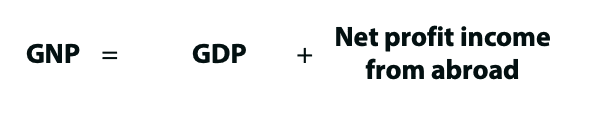
A country’s gross domestic product refers to the total value of income or production taking place in that country. It is calculated as:

A country’s gross national product takes into account income earned from abroad and also profits earned in a country being sent to foreign investors. The difference between income being earned abroad and profits being remitted to overseas investors is called the net property income from abroad. So
4 The circular flow of income
Households provide: labour, land, capital (together known as factors of production)
In exchange for:
Firm providing: wages, rent, interest
Firms: produce goods or provide services
Households: pay for the goods and services
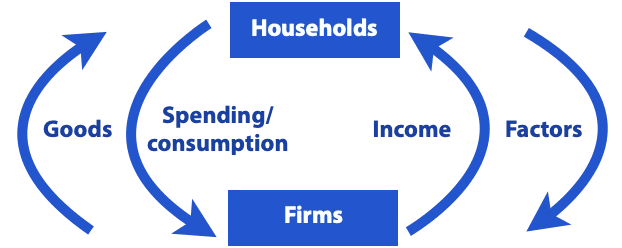
As well as money, goods, services and factors of production moving between firms and households, there are injections and withdrawals (or leakages) from the system.
4.1 Injections:
Government spending
Exports (money comes from abroad)
Investment (this is expenditure on goods in addition to household spending).
4.2 Withdrawals:
Taxation
Savings (for example, money is earned, but simply kept and accumulated)
Imports (money goes abroad)
Injections will increase the circular flow of income (for example, money flowing into the country from the sale of exports). Similarly, withdrawals will decrease the circular flow (for example, more people deciding to save).
If an economy is in equilibrium (meaning that the circular flows are constant) then injections into the economy must be equal to each other. For example, if the government suddenly printed more money and injected it into the economy by giving each person €10 to spend, then that additional money could be spent on goods and services, increasing both consumption and the supply of goods. To supply more goods, more factors of production would be bought, increasing the population’s income until a new equilibrium point is reached.
5 Aggregate supply and demand
Although money spend by consumers (consumption or expenditure) must equal the value of goods sold by suppliers (income) this does not mean that the demand for goods will always equate to the supply of goods. A product could be very popular but suppliers are not able to keep up with that demand. The imbalance between supply and demand can occur at the macro-economic level also:
Aggregate demand: the total demand in the economy for goods and services; it is the total desired demand.
Aggregate supply: the total supply of goods and services in the economy.
Aggregate demand would increase as prices decrease: lower prices stimulates demand. Aggregate supply increases as prices increase: higher prices will encourage firms to produce more.
An equilibrium (or balance) is reached when aggregate demand and aggregate supply are equal: enough is produced to exactly meet demand.
Let’s see what happens if these are not equal. Assume that because the economic situation had been a little uncertain, consumers had decided to save some of their income in case of redundancy. Then the economy picks up and consumers have more confidence to spend their savings. Suddenly aggregate demand would have increased, but the supply of goods might lag behind this sudden increase in demand. The likely effect is that there will be price rises as consumers are willing to pay more to satisfy their increased demand; production will be increased so that, once again supply will satisfy demand – but at a slightly higher price
The following graph shows what happens:
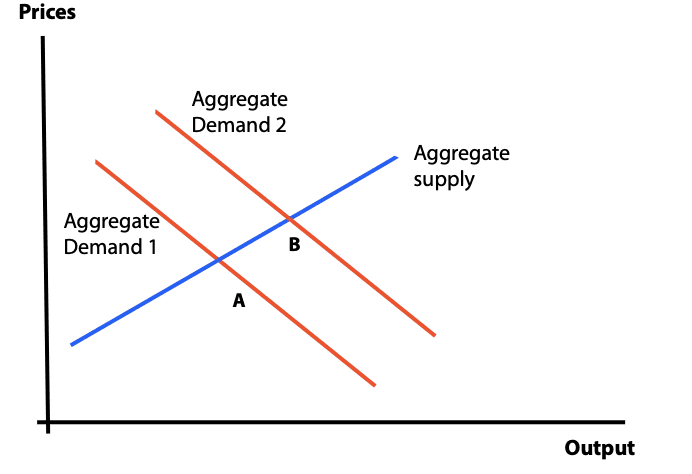
We start at point A. Aggregate supply and aggregate demand meet at this point: the quantity supplied matches the quantity of goods demanded.
When confidence in the economy rises and people are willing to spend more money, the aggregate demand shifts to the right from aggregate demand line 1 to line 2. This means that more goods are demanded at a given price.
The extra demand will stimulate producers to supply more and the equilibrium point moves from A to B. Prices are slightly higher. Of course, as production increases, employment will increase, so governments can increase employment by stimulating aggregate demand. Demand can be stimulated by measures such as:
Decreasing tax so that consumers are left with more to spend
Increasing government expenditure (eg the government borrows and spends)
Decreasing interest rates so that it is cheaper for consumers to borrow and spend
Of course, aggregate supply has limits. For example, once everyone is in employment it is difficult to satisfy further demand. Output has reached its limit
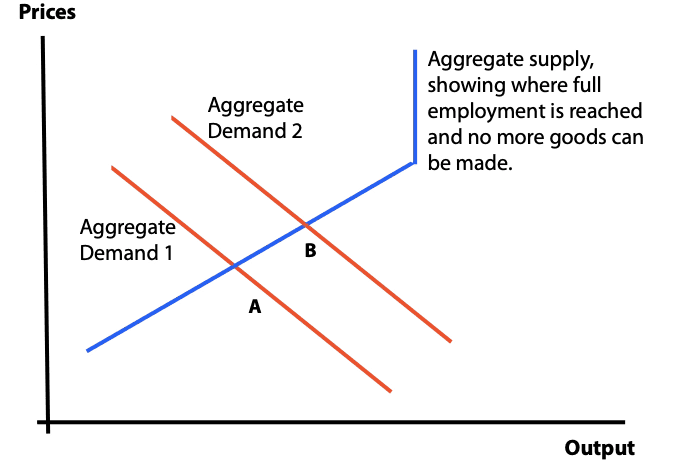
If no further goods can be made, yet demand keeps increasing, there will be a strong upward inflationary pressure on the economy as output cannot adjust to meet demand. On the other hand, if demand is lower than could be met by maximum demand, there is likely to be unemployment.
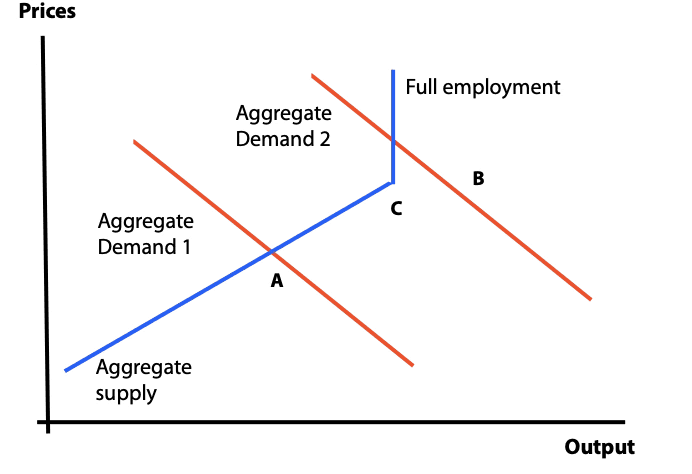
At equilibrium point A, aggregate demand is equal to aggregate supply but there is spare productive capacity and there will be unemployment. The line showing aggregate Demand 1 would have to move to the right until it went through point C where full employment would be reached. The rightward move in aggregate demand needed to achieve full employment is known as the deflationary gap.
At equilibrium point B, aggregate demand is higher than the maximum supply available. Output can’t increase so prices rise steeply as a way of making demand and supply match. The line showing aggregate Demand 2 would have to move leftward to go through point C and to achieve matched demand and supply. The distance aggregate demand would have to reduce to achieve the match at point C is known as the inflationary gap.
6 Shifts in the aggregate demand curve
This section is not talking about movement along an aggregate demand curve. Such movements are causes by changes in prices that will increase or decrease demand. We are looking at what causes demand curves to shift to the right (eg Demand line 1 moving to Demand line 2) or to the left.
Shifts to the right increase aggregate demand and is equivalent to an economy growing. Similarly, shifts to the left imply the economy is contracting. Controlling economic growth or contraction will be a key concern of all governments: fast growth can lead to inflation and can suck in imports to meet demand; fast decline can lead to mass unemployment.
Rightward shifts are caused by:
An increase in disposable income. This can be caused by, for example, lower taxes, lower interest rates, increased welfare payments.
Consumers deciding to save less (known as a lower marginal propensity to save).
Increased government spending
A more relaxed monetary policy (for example, the government simply printing more money
A change in net exports. When a country’s exchange rate weakens, its exports become cheaper to foreign buyers and this stimulates demand in the economy as more goods are demanded by overseas buyers.
Leftward shifts are caused by:
The opposite of each of the above influences
7 Inflation - causes
We need to look at the terminologies associated with two pieces of macroeconomics – inflation and unemployment.
First, inflation. What causes inflation?
Demand pull. This is where there is a lot of money in the economy, lots of people who want to spend money, and because demand is high, prices are pulled upward.
Cost push. An example of cost push inflation is where people in the manufacturing industry, let’s say coal mining, have a large wage rise. Inevitably that wage rise is passed on and will find itself reflected in the cost, say, of electricity. The cost of electricity goes up and that’s an example of cost push inflation.
Import cost inflation. A good example of that was the huge increase in the cost of oil that happened towards the end of 2008.
Expectation. This is where people expect there to be inflation and because they expect inflation, they make higher wage demands and the higher wage demands inevitably push up the price of goods that are going to be sold.
Increase in the money supply. An increase in the money supply will stimulate demand. More people have money to buy goods and this will cause demand pull inflation.
8 Unemployment
The second collection of terminology we need to look at is unemployment. What types of unemployment are there?
Real wage unemployment. This is where people are effectively being paid too much. Employers can’t afford to keep them on and therefore they lose their jobs. They’ve priced themselves out of their markets. That tends to be self-correcting because once there is a large number of people looking for job with particular skills that will tend to bring down the real wage price.
Frictional unemployment refers to the temporary unemployment of people as they move from one job to another. There will always be some frictional unemployment and it’s not terribly important socially because it is temporary.
Seasonal unemployment is obvious. It will refer to unemployment patterns in sectors such as building and agriculture where there tends to be high unemployment during the winter.
Structural unemployment is more permanent. It occurs where the structure of the industry has changed. An example of structural unemployment can be seen in the UK where we have closed most of our coal mines. It was thought to be cheaper to import coal from abroad.
Technological unemployment speaks for itself. It is unemployment brought about by changes in technology so the old skills and jobs disappeared.
Cyclical unemployment is a very long cycle of employment and unemployment as economies rise and fall. Towards the end of 2008 most of the world entered a recession. The recession is likely to last for some years and this causes high cyclical unemployment.
9 Monetary and fiscal policy
9.1 Governments have two main ways in which to control or regulate their economies:
monetary policy, and
fiscal policy.
9.2 Fiscal policy
First we’ll look at fiscal policy. And the word “fisc” is an old word which referred to the king’s purse. Where does the state get the money from? Where does it spend it? If the state wants to spend money it either has to raise income through taxes or borrow money. If it wants to reduce taxes it either has to reduce expenditure or borrow money. The three have to be in balance.
In the current recession governments are seeking to spend more money. This is a way of putting money into the economy to try to stimulate it. However, if they spend more by raising taxes they may actually not end up putting very much more money into the economy. They are taking with one hand and giving away with the other. So what most governments are doing is increasing government borrowing. Keep taxes the same; borrow money, spend it, once it’s spent it will be earned by people who will spend it again. And that’s the way in which governments hope the recession will be brought to an end.
For fiscal-policy scenarios, first decide whether aggregate demand rises or falls. Higher direct taxation is contractionary: it reduces growth and inflation and increases unemployment; the reverse pattern follows expansionary policy.
9.3 Monetary policy
The second way in which governments attempt to control their economies is by their monetary policy: managing the supply of money in the economy. The more money in the economy the more economies are likely to be stimulated. There are two main weapons.
Interest rates. If interest rates are very high people will tend not to want to borrow money. If you don’t borrow money you can’t spend it, and if you can’t spend it then, for example, demand pull inflation will be relatively low. If however you greatly reduce the interest rates more people will be encouraged to borrow. They spend that borrowed money on televisions, cars, houses, whatever. And once it’s spent the money is in the economy, other people earn it, demand goes up, and the economy is stimulated.
Credit controls. This is a control over institutions, typically banks, on how much they are allowed to lend. So for example if you put $1,000 into a bank and the reserve requirement was only 10%, that means that the bank could lend $900 out of the $1,000 deposited. That $900 could be deposited again and the bank could lend on $810 and so on. So the initial deposit of $1,000 can create a much higher amount of money in the economy. Say however that the reserve requirement was 50% - $1,000 in the bank; the bank only lend on $500. That $500 is put into another account, the bank can lend on only $250 and so on. You can see that at the end of the cycles a much smaller amount of money will be created in the economy.
10 International payments disequilibrium
When a person, business, or government imports goods and services from abroad, suppliers will normally expect to be paid in their own currencies. So, when an entity in the UK imports from the USA the supplier expects to be paid in US$ and so the buyer will have to sell UK£ and buy US$ that can be given to the seller. (Or, if the payment is made to the supplier in £, the supplier will change £ for $).
Similarly, if a UK company exported to the USA it would ultimately expect to receive £ sterling, either directly from the buyer or, if US$ were received, the exporter would change the $ to £. If imports and exports do not match then there is a disequilibrium in international payments and there will be either a net sale of £ for $ or a purchase of £ for $.
Imports and exports form part of a country’s current account as do interest and dividends received from or paid to other countries. There can also be capital movements, for example if foreign investor were to buy the shares of a UK company. For simplicity we will just look consider the balance of trade (ie imports and exports) and ignore other movements as these are usually comparatively small.
If a company imports more than it exports then it is running a trade deficit; if exports exceed imports it is running a trade surplus. As explained above, if the UK has a trade deficit with the USA then, net, it will have to sell UK£ for US$. The predominant sale of UK$ for US$ will tend to reduce the value of the UK£ compared to the US$: to sell a lot of something you have to lower the price. So the £/$ exchange rate might move from, say, £1 = $1.2 to £1 = $1.1. The effect of this is to:
For US customers this will decrease the US$ cost of imports from the UK. Something that has a UK£ price of £1000 did cost £1,000 x 1.2 - $1,200 in the USA but now costs £1,000 x $1.1 = $1,100 in the USA. This increases the UK’s competitive strength in the foreign market.
Increase the UK£ cost for imports from the USA. An item selling for $1,320 in the USA would have had a cost in the UK of $1,320/1.2 = £1,100 but would now cost $1,320/1.1 = £1,200.
The exchange rate movement therefore tends to make imports more expensive and exports less expensive and this has a correcting effect on the disequilibrium (here, a deficit) by encouraging exports and discouraging imports - to the extent that demand is elastic. However, because foreign goods now cost more (consumer goods, manufacturing raw materials and government imports are all affected) the importing country’s costs rise, standard of living falls and inflation can be stimulated. Eventually, home producers might be able to supply the goods that were previously imported.
If the UK were to keep importing more than is exports (perhaps because the foreign goods are simply better and more popular with consumers) the ongoing net sale of UK£ for foreign currencies will eventually cause foreign governments and economies to have concerns about where all the UK£ is coming from (is the UK Government simply printing more money?) and they might begin to worry that the UK£ is not a good or safe investment to buy. In response, the UK government might have to raise the interest rates paid on UK£ deposits so that buyers of UK£ are incentivised to keep buying £, despite the risk. If interest rates increase economies tend to slow down as consumers have less to spend.
Instead of dealing with disequilibriums by exchange and interest rates, countries can also limit imports by imposing protectionist measures such as:
Import quotas (ie a maximum number of units that can be imported)
Import tariffs (a tax is added to imports making them more expensive compared to domestically produced units).
Procedural methods (such a imposing very stringent safety rules and testing of imports).
11 Economic growth
Economic growth occurs when there is a rise in national income: GDP rises.
11.1 Growth is a function of:
Increasing capital goods/physical capital. For example, a factory buying a new piece of machinery so that more goods can be produced more cheaply and reliably. Improved infrastructure is also important, for example, good roads or train systems to move goods and people.
Human capital: for example, increasing the skill levels of a workforce will increase the quality, efficiency of production. Skilled workforces are also necessary to devise new goods and services that generate more demand. Note that higher skills usually implies higher remuneration and higher remuneration results in higher demand for goods and services. Note that population increases often create economic growth (more people requiring food, clothing and shelter) whilst population decreases can lead to economic stagnation.
Technology: as noted above, skilled workforces are needed to generate innovation and new technologies. For example, the invention of tablet computers created huge economic growth. Improved solar panel technology stimulates more households and businesses to buy, instal and maintain solar panels.
Natural resources: for example, a country discovers that it has valuable mineral deposits of the metals needed in electronic devices. Discover of oil and gas stimulated economic growth in many countries though this might start to level off as renewables become favoured.
11.2 Economic growth can promote the following benefits:
Reduced poverty
Better housing
Better medical facilities
Better education
Better public services because the government’s tax revenues will increase.
However, economic growth can have the following drawbacks:
Increased inflation. If more people are richer, demand increases and this can push up the cost of goods
Pollution as factory output and transport increase
A current account deficit. The extra goods demanded by the richer population can stimulate imports if the home country os not ca[able of adequate production.
12 Functions of taxation
Taxation has many functions. We’ve already pointed out that it raises revenues for the government but it’s also used for other purposes. For example, to discourage certain activities regarded as being undesirable. And a good example here would be a tax on cigarettes.
It can also be used to cause certain products to be priced to take into account their social costs. There is increasing talk for example about a carbon tax of some sort because it is argued that if you drive a car or fly in a plane the release of carbon has a social cost that ought to be paid for.
Obviously, tax can be used to redistribute income and wealth. Frequently people with higher income and more wealth are taxed more highly and that is redistributed through government expenditure to people who have less wealth.
It can be used to protect home industries from foreign competition; examples are import duties, import tariffs where imports have a tax attached to them to make them more expensive relative to the home-produced products.
Finally it can provide a stabilising effect on national income. Governments are often committed to long-term expenditure plans but if the economy falls somewhat governments might seek to increase the tax take so that the national income stays up and they don’t have to borrow any more.
13 Types of taxation
13.1 Taxes can be described as:
regressive,
proportional, or
progressive.
A regressive tax takes a higher proportion of a poor person’s salary than it does for a rich person. A simple example is VAT. If the VAT rate is 20% it doesn’t matter whether you are rich or poor you still pay 20% and that is proportionally more taken from a poor person’s pay than it is from a rich person’s income.
A proportional tax takes exactly the same proportion of income tax from all levels of income. So you could have a flat rate tax which taxes everyone at say 10% from the very first dollar earned, up to millions of dollars.
A progressive tax takes a higher proportion of income as income rises. So maybe for the first $1,000 of income the tax rate is zero, for the next $4,000 of income the tax rate is 20%, and anything beyond that is taxed at say 40%. A progressive tax would obviously be more effective at redistributing wealth and income than either a regressive or a proportional tax.
Couple of more terms on tax.
A direct tax is paid directly by a person to the revenue authority. A good example there would be income tax. A certain proportion of your income goes directly to the revenue authority.
An indirect tax is collected by the revenue authority from an intermediary, normally a supplier of some sort. A good example of an indirect tax is VAT. You buy something, you pay over the total purchase price, and then the seller passes some of that on to the government.
Some taxes are charged a fixed sum per unit sold. So if you were to buy a bottle of wine it doesn’t matter whether it costs $5, $10 or $25; a fixed sum will go to the government.
An ad valorem tax is charged as a fixed percentage of the price of the good. A good example of an ad valorem tax is VAT.
Macroeconomics
7 questionsAnswer the questions one at a time. Your progress is saved so you can leave and come back.
Open chapter practice