
Non-Financial Performance Measurement

Evaluate a proposed KPI using: strategic alignment, precise definition, data reliability, controllability, timeliness, benchmark or target, possible gaming and balance with other measures. Distinguish evaluation of the KPI from analysis of the organisation's actual performance.
When a performance model is supplied in the question, do not spend time reproducing or describing its headings. Use the requested headings to structure the answer and assess whether each existing measure supports the heading, the organisation's objectives and the problems in the scenario.
1 Net Promoter Score
Net Promoter Score (NPS) is a customer advocacy measure based on the question: how likely is the customer to recommend the organisation, product or service to another person? Responses are normally recorded on a scale from 0 to 10.
Promoters: scores of 9 or 10
Passives: scores of 7 or 8
Detractors: scores from 0 to 6
NPS = percentage of promoters – percentage of detractors
The result can range from –100 to +100. Passives are included in the total number of respondents when the percentages are calculated, but they are not deducted or added in the formula.
1.1 Illustration
Of 200 customers, 110 are promoters, 50 are passives and 40 are detractors.
Promoters = 110 ÷ 200 = 55%
Detractors = 40 ÷ 200 = 20%
NPS = 55% – 20% = +35
1.2 Evaluation
NPS is simple, easy to communicate and can be tracked over time or across business units. It can direct attention to customer experience and future loyalty.
However, it does not explain why customers gave their scores. The response rate and sample may be biased, cultural scoring patterns may differ, and an intention to recommend does not guarantee actual purchase or profitable loyalty. Comparisons are most useful where the question, timing, channel and customer population are consistent. Management should analyse reasons, complaints, retention, repeat purchase and customer profitability alongside NPS.

2 Brand awareness and brand loyalty
2.1 Brand awareness
Brand awareness is the extent to which customers recognise or recall a brand. Measures may include aided awareness, unaided recall, share of search, website traffic, social-media reach and the percentage of target customers who recognise the brand.
High awareness can support future sales, but awareness alone may be negative or may fail to produce purchase. Measures should therefore distinguish the target market and be linked to consideration, conversion and customer value.
2.2 Brand loyalty
Brand loyalty is the tendency of customers to continue choosing the brand. Measures may include retention rate, repeat-purchase rate, purchase frequency, share of customer spending, renewal rate, switching rate and customer lifetime value.
Loyalty may reduce acquisition costs and make revenue more predictable. Nevertheless, repeat purchase can result from contracts, inconvenience or lack of alternatives rather than genuine preference. Management should combine behavioural measures with customer attitudes and profitability.
2.3 Using the measures
A useful chain of analysis is: awareness leads to consideration; consideration may lead to trial; satisfactory experience may lead to repeat purchase, advocacy and long-term value. Weak performance at one stage helps management identify where action is required. The measures should be segmented by customer type and compared with strategy, targets, trends and competitors.
Exam focus: calculate NPS, interpret the sign and movement, then evaluate sampling and causal limitations. Recommend a small set of customer and brand measures that fits the scenario rather than listing every possible measure.Introduction
In the previous two chapters we were looking at measures of financial performance. However, as we stated, it is important to have a range of performance measures considering non-financial as well as financial matters.
In general, financial performance is easy to measure (earning per share, profit, dividends, EVA etc) but these measurements do not tell managers why financial performance has improved. For example, sales might have increased either because prices have been lowered or the company has spent money developing a new, innovative product. In this chapter we will consider the various areas where performance measures are likely to be needed.
Note that although we might all like to think that, for example, customer service is a foundation for company success, it is not necessarily so. Some low-cost airlines have been very successful despite giving poor customer service. Good customer service, and the other non-financial qualities which are mentioned about below are not ends in themselves. They become important in profit seeking organisations only if the enable financial success.
In not-for-profit organisations, non-financial measures can be ends in themselves. For example, in a hospital patient service is likely to be a fundamental part of its mission.
Various authors have summarised the areas in different ways and the main approaches are summarised in this chapter.
3 Fitzgerald and Moon building blocks
Fitzgerald and Moon focussed on performance measurement in service businesses. They said that organisations need:
Measures: dimensions of performance that should be measured
Standards: KPIs need to be capable of ownership (ie the person responsible feels able to influence the measure), should be achievable and should be fair.
Rewards: should be clear, provide motivation and controllable ie managers can influence their rewards by their behaviour.
Common non-financial performance measures are:
Quality measures (eg repairs required within one year)
Warranty claims
Customer satisfaction surveys
Customer number growth
Returns volume
Repeat business
Internet page visits
Placement in independent surveys
Speed of response to customer queries
How quickly telephone are answered
Number of new products launched each year
Students’ success rates in a training business
Patients cured (hospital)
Vaccines administered
Waiting times for appointments
Of course there are complications. For example, when assessing the success of a school there will be some dependence on the pupil catchment area. When assessing surgeons, it could be that the best will be assigned to the most difficult operations so might have lower success rates than less talented colleagues. Repeat business will be difficult to assess for major purchases: how often do you expect someone to buy a new washing machine?
However, it is important to make an effort to assess non-financial performance because, as noted above, good performance in service and quality will usually underpin good financial performance.
They suggested that the following dimensions need measures of performance:
Performance area | Possible measures |
Financial performance | Profitability |
Competitive performance | Sales growth |
Quality | Rejects/reworks |
Flexibility | Spare capacity |
Resource utilization | Idle time |
Innovation | New products brought to market |
4 Kaplan and Norton’s Balanced Scorecard
The balanced scorecard (developed by Kaplan and Norton 1992) views the business from four perspectives and aims to establish goals for each together with measures which can be used to evaluate whether these goals have been achieved. These should be viewed as a hierarchy with good financial performance depending on ‘happy’ customers, who are ‘happy’ if we do what we say we will do. Continued success demands that organisations never stop trying to improve through learning and innovation.
Perspective | Question | Possible Measures |
Financial Perspective | How do we create value for our shareholders? | Profitability |
Customer Perspective | What do existing and potential customers value from us? | % Sales from new customers |
Internal Business Perspective | What process must we excel at to achieve our customer and financial objectives? | Unit cost analysis |
Innovation and | How can we continue to improve and create future value? | Number of new products introduced |
5 The Performance Pyramid
Lynch and Cross viewed business as a performance pyramid.
The pyramid views a range of objectives for both external effectiveness and internal efficiency. The objectives can be achieved through measures at various levels as shown in the pyramid below. These measures are seen to interact with each other both horizontally at each level and vertically across levels in the pyramid.
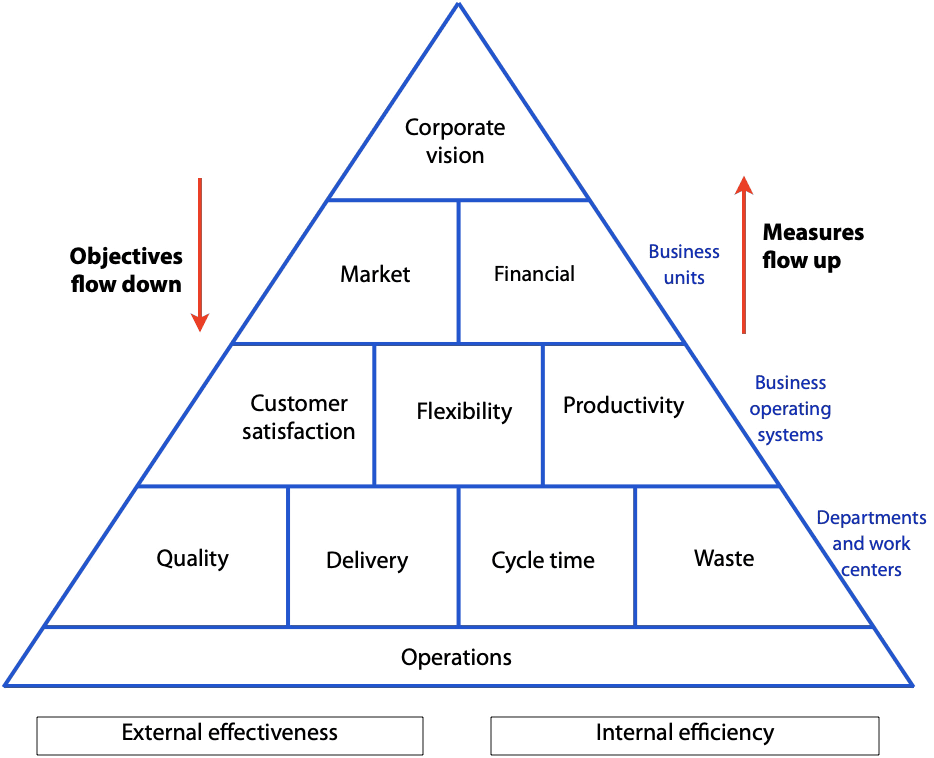
Operations carried on in departments and work centres: quality, delivery, cycle time and waste. These operations support the layers further up the pyramid.
Companies must achieve customer satisfaction, productivity and flexibility – the ability to adapt to different customer requirements and methods of production. Customer satisfaction arises from quality and delivery. Productivity arises from system time and waste; flexibility arises from delivery and cycle time.
A strong performance in the market depends on customer satisfaction and flexibility towards different environments. Financial performance depends on productivity and flexibility.