
Skip to content

ACCA Forums

APM*** ACCA P5 December 2016 Exam was.. Instant Poll and comments ***

Oopentuition_teamAdmin9y ago

Please vote in our Instant Polls about the ACCA P5 December 2016 Exam.
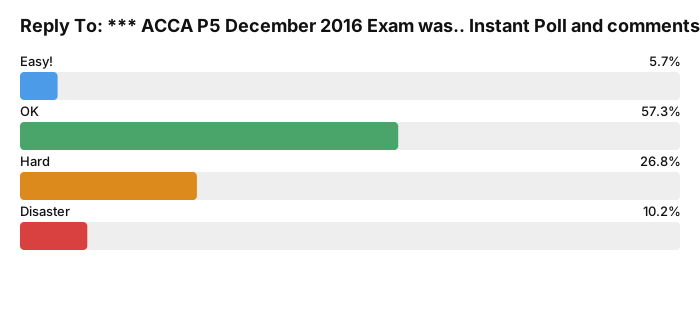
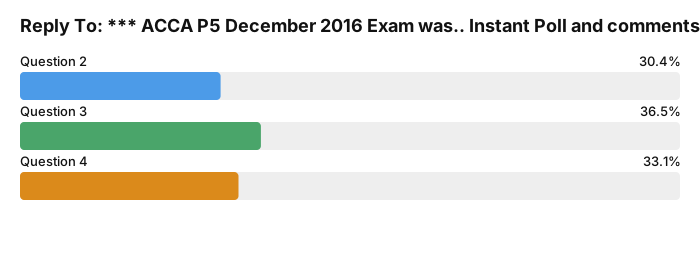
*** ACCA P5 December 2016 Exam was.. Instant Poll and comments *** poll results *** ACCA P5 December 2016 Exam was.. Instant Poll and comments *** poll results

Post your comments about the ACCA P5 exam below

 
Former userFormer user9y ago#31
@mona216 said: In question one part c I used the maximax, maximin approach but I have a question.Was the figures of 3.8 /4/4.2 meant to be revenue per day or costs incurred per day??
From my point of view 3.8 /4/4.2 were sales and by applying the contribution/sales ratio you would have obtained the contribution value.
CCastells9y ago#32
@ish123 said: For question 2, can anyone remember the mark split for A and B? Also how did you guys do the FX part for A? I knew it will consume lot of time so took a shortcut by looking at the percentage increase from 1.4 to 1.5 meaning 7% decrease in COS and as it applies to only 50% of the COS I just decreased total COS by 3.5% (I know its not the correct way but hoping after rounding the figure should be close)
I think that exchange rate changed from 1.5 to 1.4 so making raw materials more expensive. In the narrative explained something in this sense also.
MMona9y ago#33
That's what I thought then I was confused as it said amounts spent at each site (or something like that) so thought of it as cost of sales
MMichal9y ago#34
Revenue up 2 or 2.5% dont remember. COS% (59.33%) * new Revenue. (as it was driven by volume increase, therefore cost of sales stays the same %wise assuming that volume increase had the same product mix as total company. (which wasn't specified so fair assumption) In next point of 1.5% selling price increase new cos% from below * old_revenue (before 1.5% selling price increase, as price increase flows down all the way to profit and does not increase COS). New cos / 2 * (1.5/1,4) = New COS/2 * 1.07 I used exactly the same method ish123, as change in exchange rate from 1.4 to 1.5 gives 7% incremental cost. Found this Q quite straight forward, as I have done quite a lot of such modelling at work, BUT ran out of time to do all the calcs :) so stopped at half way at A and went on to score some marks on section B.
BBilal9y ago#35
I founf the paper easy and question 1 especially tricky. Loads of information to go through for question 3 and 4. I messed up with the risk uncertainty question in question 1 and BCG matrix in part A of the question 3. Question 4 was never seen before in any of the past papers in any of the past papers. I hope for the best.
Former userFormer user9y ago#36
@rubyguby said: It was suspiciously easy. I just hope I didn't miss anything...
Just like you i considered 50% of the COS being the ingredient which I divided by 1.4 to find out how much was in local currency and then multiply that value with the new exchange rate => increase in the cost of the ingredient.
IIC9y ago#37
@agostinho said: I think that exchange rate changed from 1.5 to 1.4 so making raw materials more expensive. In the narrative explained something in this sense also.
Are you sure? I thought it said from Q2 the fx has changed to $1 to 1.5. Then the narrative stated for the previous calculation they were using 1.4? I could be wrong.
MMichal9y ago#38
In Q1, 3.8 4 and 4.2 were average revenue per customer visit. (Customer spend AFAIK means how much each customer spends during visit - therefore avg revenue per customer) 360 days * number of customer visits (expected value for each abc) * 3.8/4/4.2 gives revenue for the year for each abc.
CChris9y ago#39
Was confident coming out as I understood all the theory in this paper. Question 1,c, I basically just calculated the likelihood of each restaurants % visitor rates using the figures then multiplied these by the expected spend per person which produced a table of figures - I then pointed out the highest payoff and stated that the s/h would have selected this due to there fairly high risk appetite. This was the maximax option. I found the performance report in q1,a strange as the figures were all the same?? anyway explained the weaknesses in the report and what they could do to improve. the budgeting question part a was tricky although I think the majority of my calculation will be near the mark. Though it was mainly a case of taking the percentage applicable an then adding on a bit or taking away a bit depending what the situation was for example the exchange rate change. Diary incremental Luxury rolling. Q3 again did not appear straight forward but I think I grew into it. felt there were a number of further metrics which would have helped each division better monitor performance, stated a few example like price elasticity etc. Second part I think was to do with identifying the correct strategic objectives and then the right metrics to ensure these are met - the objectives will be set based on which cube within the BCG matrix the division is within. As with all these exams everyone has a slightly different approach and style and will make differing cases and points - I just hope I have picked up enough marks to pass well as I studied very hard.
RRonnie9y ago#40
Based on my understanding : For the COS in Q1, the value of C$1 - V$1.40 increased to 1.50 thus the C$ currency strengthened. This would lead to reduction in cost due to gain in forex. I calculated by translating 50% of COS with 1.4 then divide by new rate 1.5. As for the risk and uncertainty question. The paragraph indicated that the directors are risk seekers but there was a phrase following saying something like "other models should still be calculated" My interpretation is "maximax is applicable, but still do the other generic methods, e.g. maximin, minimax regret & EV for P5 sake" haha
RRyan9y ago#41
I see someone mentioning all three projects just over $200k which is what I got. Wasn't particularly comfortable with this area but there was my approach: Revenue avg per customer: $4 Customers: 1200 Daily revenue: $4800 Yearly revenue (x365): $1,752,000 Contribution (multiplied the above by this rate - something like 58%): $1,016,160 Less fixed costs ($900k): $116,160 Multiply by probability (10%) EV = $16,160 Then repeated process for the other two demand levels and added up as my EV. Repeated this process for project B and C. I assumed MaxiMax would be the project with the highest return, regardless how low that percentage. Then vise versa for MaxiMin. But appears we needed to use the annuity tables for this, according to some comments? :/
CChris9y ago#42
Looks good except question explicitly said days were 360. No annuity tables required lol. I thought the exchange rate moved favourably also
Former userFormer user9y ago#43
@ jeffy. The report was a template which the franchises are meant to populate n share with their stakeholders. This suggest dat dere is no need to talk about the figures. my approach to discuss th e evaluation wss under d following headings. ( purpose, audience, info for decision making n layout) . then the metrics are largely financial n most time profit measures. A balanced score card kinda metric can b into duce or more appropriately the building block as des is developed for service org just lik bavus
Former userFormer user9y ago#44
@rontjx said: Based on my understanding : For the COS in Q1, the value of C$1 - V$1.40 increased to 1.50 thus the C$ currency strengthened. This would lead to reduction in cost due to gain in forex. I calculated by translating 50% of COS with 1.4 then divide by new rate 1.5. Wat part of question 1 is des?
SSarah9y ago#45
Yes @Farai that is the correct method. However as format C had the highest c/s ratio you should have found that at the highest demand this was most profitable, as the higher contribution covered the increased fixed costs. At lower levels of demand A was better as it had lower fixed costs.
MMairead9y ago#46
Yes yinka I think my score was 5.73 so just within the grey area !!!
Former userFormer user9y ago#47
I referred to maximax the while scenario but went overkill on the probability percentages and chose format A with the 1400 demand as the preferred choice based on my calculations and came to a conclusion of 3.7.... does this ring bells with anyone else or did I totally go off on a tangent?
Former userFormer user9y ago#48
I referred to maximax the while scenario but went overkill on the probability percentages and chose format A with the 1400 demand as the preferred choice based on my calculations and came to a conclusion of 3.7…. does this ring bells with you or did I totally go off on a tangent?
HHarsha9y ago#49
For q1 risk and uncertainty ques,i got format A as well. I considered maximax approach only. For part b, i elaborated the building blocks model for bavus...has anyone done same for part b?
Ssaqibkhan9y ago#50
i kinda lost it by looking at Q4- Gscore , i only came across the Z score & A score in the book
Former userFormer user9y ago#51
Hmmm. It's actually akin to z score. its just to calculate with info provided
LLee9y ago#52
@hpanchoo2206 said: For q1 risk and uncertainty ques,i got format A as well. I considered maximax approach only. For part b, i elaborated the building blocks model for bavus...has anyone done same for part b?
Yes Harsha. I elaborated on the Standards(Target) section of the Building Block Model.
Ddan9y ago#53
For Maxi max, Maxi min, and regret, you do not need to do the probabilities. Only on neutral you do expected values ? The figures were all the same on the performance report in Q1 as it was a template that the franchisees use. Was quite nice that it missed out all the non financials so it gave us an opportunity to comment on loads of them hinted at in scenario( Quality, clean etc). probability question made me chasing my tail for the rest of the exam as it took ages I found. Managed to finish everything to the standard I would have wanted just hope it's enough ! Only thing I had to miss was the exchange rate on Q2 so probably lost 2-3 marks but hey ho ! The fuel had something like 70% related to distribution. So extracted the 30% to add in after, then did the increase in fuel to 59 and 63% in the relevant quarters then added the 30% in at the end again. For the G score I thought it was a lot of marks for what it was. I did a calculation just doing one of them (G2 or G3 I think it was) as PBIT instead of EBITDA and it actually reduced the score to at risk of failure and then started slating into EBITDA for masking performance (maybe not relevant). Using EBITDA I think I got 4.17 or something like that overall. For anyone else who this is their last exam good luck ! Hard to forget about it when these forums are around lol. Even if people have different answers follow through will be key along with ensuring we commented on whatever answers we got sufficiently. GOOD LUCK !
RRyan9y ago#54
@irondan11 said: For Maxi max, Maxi min, and regret, you do not need to do the probabilities. Only on neutral you do expected values ? The figures were all the same on the performance report in Q1 as it was a template that the franchisees use. Was quite nice that it missed out all the non financials so it gave us an opportunity to comment on loads of them hinted at in scenario( Quality, clean etc). probability question made me chasing my tail for the rest of the exam as it took ages I found. Managed to finish everything to the standard I would have wanted just hope it's enough ! Only thing I had to miss was the exchange rate on Q2 so probably lost 2-3 marks but hey ho ! The fuel had something like 70% related to distribution. So extracted the 30% to add in after, then did the increase in fuel to 59 and 63% in the relevant quarters then added the 30% in at the end again. For the G score I thought it was a lot of marks for what it was. I did a calculation just doing one of them (G2 or G3 I think it was) as PBIT instead of EBITDA and it actually reduced the score to at risk of failure and then started slating into EBITDA for masking performance (maybe not relevant). Using EBITDA I think I got 4.17 or something like that overall. For anyone else who this is their last exam good luck ! Hard to forget about it when these forums are around lol. Even if people have different answers follow through will be key along with ensuring we commented on whatever answers we got sufficiently. GOOD LUCK !
These forums are actually a nightmare for convincing yourself that you've messed everything up. I guess the Maximax calculation (that I wasn't aware of) appears to be the right approach to answer Q1 ... just looked at a past question in the BPP revision kit and there's a similar style to be fair with the above approach! :-/ I'm not sure how this will translate into the marking scheme, whether the students that applied Expected Values will be completely penalised - I'll need some healthy marks on my calculations to have a chance at passing this paper. Anyway, hopefully the vast majoirty of us pass! Final one and I feel so drained. Really don't want to do another exam ever again.
Eemmanuel9y ago#55
I hope for the better, I did q1,2,3 and I thought the opinions from others match with what I did. q3 gave some hard time
Aacca03939y ago#56
@yinka228. Yes, I also got grey area needing further investigation and part b liquidity I tested current ratio and found it was over 1 which is OK indicating ability to settle obligations as they fall due, so the G score alone is not to be used in isolation.
Llalawhite9y ago#57
if you calculate maximax, maximin and min regret are already calculated? really only one table. then calculate the EV using the probabilities given. I said the scenario stated they were risk seeking so said they would choose c. but i definded all risk appetites and said what they would choose. (shoot the dog, milk the cow) - like this quote! ha ha found the budget recalculation finicky and time consuming but easy marks if it's correct. I calculated the G score to be just over 4 so at risk of failing and talked about the model which is a tiny bit different to the z score i.e. the g score was country specific an OK paper overall - fair, but very easy to mess up if you ran out of time. fingers crossed I passed!
RRonnie9y ago#58
Sorry, just saw this. It was Q2 one of the adjustments
RRonnie9y ago#59
Sorry, just saw this. It was Q2 one of the adjustments
@yinka228 said:
CChris9y ago#60
Guys see if the first adjustment in the budgeting question where it stated that Sales volumes are expected to be 2% higher each quarter than forecast in the current budget. How did you tackle this?
Sign into reply to this topic.