The Normal distribution - Management Accounting (MA)
YouTube video
38 Comments
Q
Quan·
Excuse me, sir.
I think we have a small matter in Example 3:
50% of 95% must be equal to 47.5% (0.475 => z= 1.96).
Length = 1.96 x 0.2 = 0.392
X = 10 - 0.392 = 9.608
So, there is a 95% probability that the length will be more than 9.608 cms.
Please help us re-check, sir.
Thank you so much.
J
Joseph·
please how did you get the z as 1.645
J
John MoffatTutor·
By working backwards through the tables. 1.64 gives a result of 0.4495, 1.65 gives a result of 0.4505.
So to get 0.45 (45%) it is between 1.64 and 1.65.
J
jabu·
i thought the z score answer in the normal distribution table represents the area lying to the left of the given X value
J
John MoffatTutor·
It is to the left or to the right because the curve is symmetrical.
M
Muhammed Saleem·
Sir, if Z = (x - x bar) / S.D.,
in the eg. 2 (c) part the answer should come like this nah,
(9.8 - 10) / 0.2 = -1 because the x is 9.8 and xbar is 10..
Am I correct????
J
John MoffatTutor·
Yes, but it doesn't matter if it is positive or negative because the curve is symmetrical. Therefore the sign does not matter.
M
Muhammed Saleem·
ok thank u sir
J
John MoffatTutor·
You are welcome :-)
A
Annsh·
Hey John, in example 2, shouldn’t the 50% of 10 cms be 5, or am I doing something wrong?
J
John MoffatTutor·
50% of 10cm is indeed 5cm, but that is not what the question is asking for.
It is asking what proportion of all the units will have a length of 10cm, and because 10cm is the average it means that half (50%) of the units are longer than 10cm, and half of them are less than 10cm.
S
Sohaib·
sir in the exam. if the answer is fill in the blanks. should we write it as a percentage or decimal?
J
John MoffatTutor·
It will be made clear which is required :-)
M
Morgan·
what if the Arithmetic mean was say 14 would we still say it is 50% more if the question was to find a proportion more than 14?
J
John MoffatTutor·
Yes. The curve is symmetrical about the mean and so the proportion more (or less) than the mean is always 50%.
N
Nyasha·
Thank you sir for the lecture. Why doesn't this chapter and the last chapter have practice questions?
N
Nyasha·
This is new to me and I would love to exercise it a bit more please
J
John MoffatTutor·
I will add questions at some stage. However you will find lots of questions in your Revision Kit (and it is essential that you get a Revision Kit from one of the ACCA Approved Publishers :-) )
S
Sabyasachi·
Sir, in example 2 (b) if the question asked us to find proportion having length more than 10.4 cm would we have done:
0.5 - 0.4772 ?
J
John MoffatTutor·
Yes we would :-)
A
Abdul Basit·
In what cases do we subtract the probability from 0.5?
J
John MoffatTutor·
When we are looking for the probability of being above or below a certain value (as I show in my free lectures).
A
Asif·
Greetings sir,
I feel the answer should have been calculated by adding the z to the mean, and not subtracting it.
z = (x - xbar)/sd
1.645 = (x - 10) / 0.2
1.645x0.2 = x - 10
0.329 = x - 10
0.329 + 10 = x
10.329 = x
J
John MoffatTutor·
If you are referring to example 3, then that cannot possibly be the answer.
There is a 50% chance of being more than 10, so how can there possibly be a bigger chance of it being more than 10.329? It would make no sense at all.
A
Asif·
The algebra of the formula shows another answer as demonstrated. If you don’t agree, how do you reply to the working I showed you ?
Perhaps we could say, that 50% chance there is of it being below 10 - as it is above as the distribution is symmetrical, and then we apply the first 50% to below 10, and the balance of the probability of the 95%, ie 45% to above the 10.
In the end, shouldn’t the interpretation of the probability distribution be subject to the formula calculation ?
Awaiting your reflection and suggestion.
Thankyou.
J
John MoffatTutor·
You cannot learn this just as playing with algebra.
Draw the curve in the way that I do in my lecture - the answer could not possibly by 10.329 as I wrote before.
S
Sabika·
So that means if theres 50% more chances that its more than 10cm then in that case the formula would be
Z=10-x divide by 0.2
?
J
John MoffatTutor·
As I wrote before, there is no point whatsoever in simply learning formula without understanding.
The z value is the different between the mean and the point being considered, divided by the standard deviation.
Because the curve is symmetrical it is irrelevant when calculating the z value whether the point being considered is more or less than the mean.
A
Anthony·
the application used to derive the algebraic expression is wrong. we know that 50% is above the mean. and the probability than the length will be more than X is 95%, meaning that the point x is bellow 10cm and in the expression for the Z score you need to subtract the X from the average (10cm)
Z =(10-x)/0.20
where z=1.645
1.645=(10-X)/0.20
1.645*0.20=10-X
0.329 = 10-X
X=10-0.329
X=9.671
which is same as the lecturer
U
Univer·
Where is 1.645 coming from?
F
Fionnghuala·
A new topic for me, but you explained it so well as always. I was so confused initially reading the example questions but had a few "aha moments" during the lecture. So thank you for helping me to get my head around it. :)
J
John MoffatTutor·
Thank you for your comment :-)
A
ABDULLAHI·
sir,in determining the proportions of what is less than a mean(say 9.8 as in example2) can you work with the value directly by dividing with SD as done for those above and then change to standard form. like 9.8/0.2=49(4.9*10^1 then look up in the table just like in logarithms and indices).
J
John MoffatTutor·
No. You can only use the tables directly to find the proportion between the mean and some other value (here, between 10 cms and 9.8 cms).
F
faizalcs·
Hi sir,
Please explain this questions.
Q1)A normal distribution has a mean of 75and a variance of 25.
what is the upper quartile of this distribution?
Q2)A normal distribution has mean of 150,and a standard deviation of 20.
80% of the distribution is below which of the following (approximately)?
J
John MoffatTutor·
In future please ask this kind of question in the Ask the Tutor forum, and not as a comment on a lecture.
For the first question you need to find the value that has a probability of 25% (0.25) of being above the mean.
For the second question you need to find the value that has a probability of 80 - 50 = 30% (0.30) below the mean.
In both cases you need to work backwards in the tables to find the number of standard deviations (the z score) in the way I explain in the lectures.
I
Izabel·
what if the z score for 10 and 10.4 is 2. 96
then the area from curve table that we would choose is 2.906 's = 0 .4985 ?
I
Izabel·
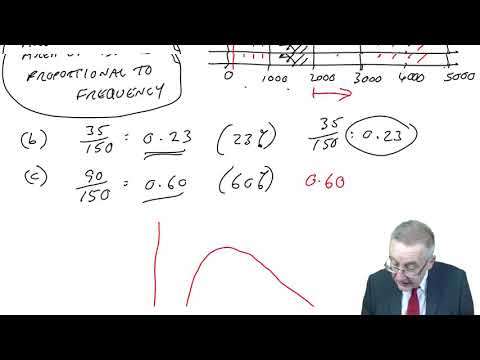
Hi SIr,
Can you please explain again what you meant by area of bar is proportional to frequency.
I cant seem to understand it

I think we have a small matter in Example 3:
50% of 95% must be equal to 47.5% (0.475 => z= 1.96).
Length = 1.96 x 0.2 = 0.392
X = 10 - 0.392 = 9.608
So, there is a 95% probability that the length will be more than 9.608 cms.
Please help us re-check, sir.
Thank you so much.
So to get 0.45 (45%) it is between 1.64 and 1.65.
in the eg. 2 (c) part the answer should come like this nah,
(9.8 - 10) / 0.2 = -1 because the x is 9.8 and xbar is 10..
Am I correct????
It is asking what proportion of all the units will have a length of 10cm, and because 10cm is the average it means that half (50%) of the units are longer than 10cm, and half of them are less than 10cm.
0.5 - 0.4772 ?
I feel the answer should have been calculated by adding the z to the mean, and not subtracting it.
z = (x - xbar)/sd
1.645 = (x - 10) / 0.2
1.645x0.2 = x - 10
0.329 = x - 10
0.329 + 10 = x
10.329 = x
There is a 50% chance of being more than 10, so how can there possibly be a bigger chance of it being more than 10.329? It would make no sense at all.
Perhaps we could say, that 50% chance there is of it being below 10 - as it is above as the distribution is symmetrical, and then we apply the first 50% to below 10, and the balance of the probability of the 95%, ie 45% to above the 10.
In the end, shouldn’t the interpretation of the probability distribution be subject to the formula calculation ?
Awaiting your reflection and suggestion.
Thankyou.
Draw the curve in the way that I do in my lecture - the answer could not possibly by 10.329 as I wrote before.
Z=10-x divide by 0.2
?
The z value is the different between the mean and the point being considered, divided by the standard deviation.
Because the curve is symmetrical it is irrelevant when calculating the z value whether the point being considered is more or less than the mean.
Z =(10-x)/0.20
where z=1.645
1.645=(10-X)/0.20
1.645*0.20=10-X
0.329 = 10-X
X=10-0.329
X=9.671
which is same as the lecturer
Please explain this questions.
Q1)A normal distribution has a mean of 75and a variance of 25.
what is the upper quartile of this distribution?
Q2)A normal distribution has mean of 150,and a standard deviation of 20.
80% of the distribution is below which of the following (approximately)?
For the first question you need to find the value that has a probability of 25% (0.25) of being above the mean.
For the second question you need to find the value that has a probability of 80 - 50 = 30% (0.30) below the mean.
In both cases you need to work backwards in the tables to find the number of standard deviations (the z score) in the way I explain in the lectures.
then the area from curve table that we would choose is 2.906 's = 0 .4985 ?
Can you please explain again what you meant by area of bar is proportional to frequency.
I cant seem to understand it